Immigrants from Fiji vs Venezuelan Self-Care Disability
COMPARE
Immigrants from Fiji
Venezuelan
Self-Care Disability
Self-Care Disability Comparison
Immigrants from Fiji
Venezuelans
2.8%
SELF-CARE DISABILITY
0.0/ 100
METRIC RATING
300th/ 347
METRIC RANK
2.2%
SELF-CARE DISABILITY
99.9/ 100
METRIC RATING
27th/ 347
METRIC RANK
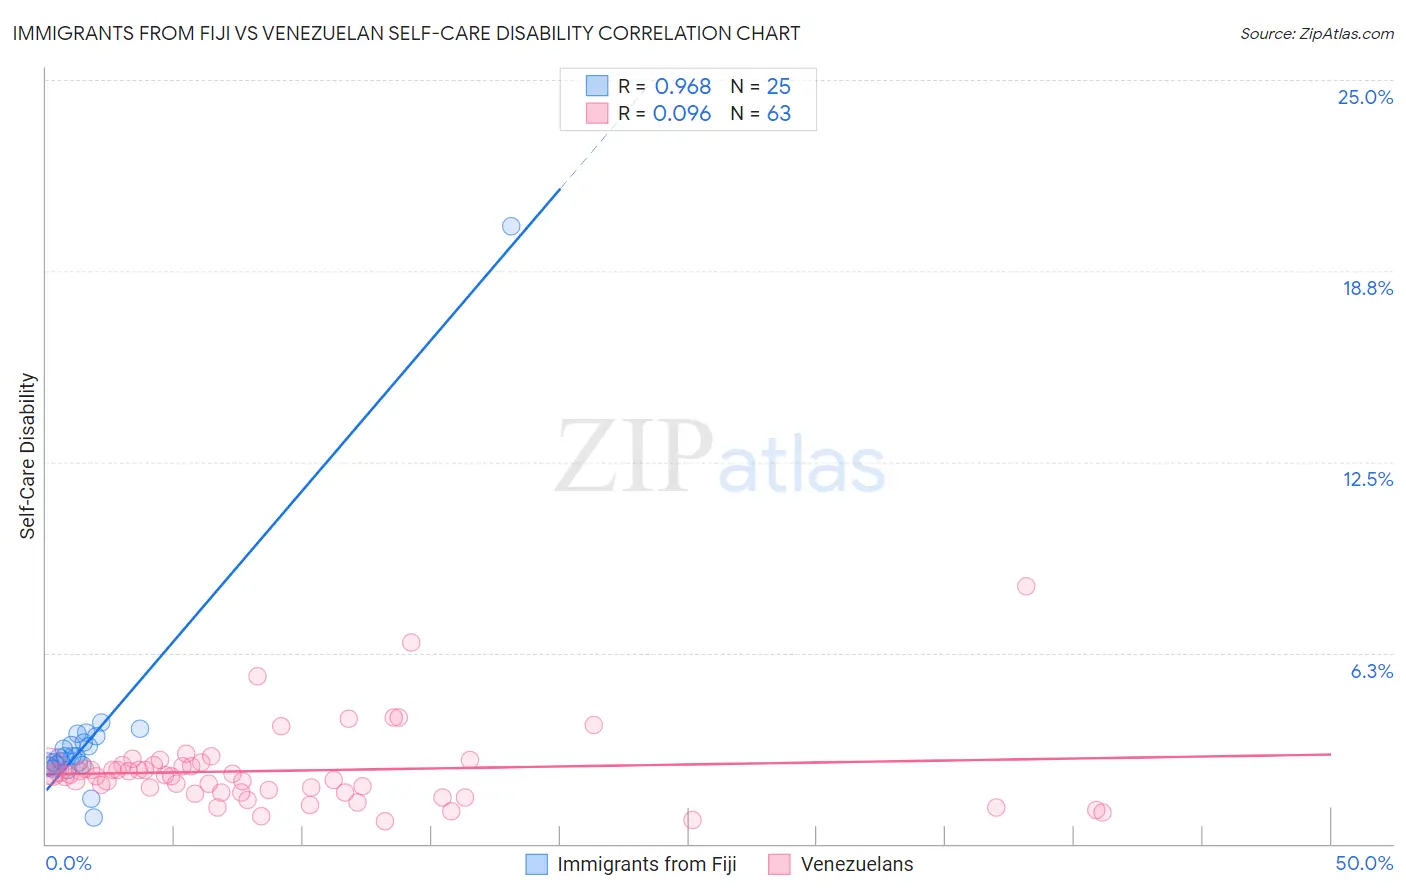
Immigrants from Fiji vs Venezuelan Self-Care Disability Correlation Chart
The statistical analysis conducted on geographies consisting of 93,753,839 people shows a perfect positive correlation between the proportion of Immigrants from Fiji and percentage of population with self-care disability in the United States with a correlation coefficient (R) of 0.968 and weighted average of 2.8%. Similarly, the statistical analysis conducted on geographies consisting of 306,028,840 people shows a slight positive correlation between the proportion of Venezuelans and percentage of population with self-care disability in the United States with a correlation coefficient (R) of 0.096 and weighted average of 2.2%, a difference of 23.8%.
Self-Care Disability Correlation Summary
| Measurement | Immigrants from Fiji | Venezuelan |
| Minimum | 0.86% | 0.74% |
| Maximum | 20.2% | 8.4% |
| Range | 19.4% | 7.7% |
| Mean | 3.5% | 2.4% |
| Median | 2.9% | 2.3% |
| Interquartile 25% (IQ1) | 2.6% | 1.7% |
| Interquartile 75% (IQ3) | 3.4% | 2.6% |
| Interquartile Range (IQR) | 0.86% | 0.90% |
| Standard Deviation (Sample) | 3.5% | 1.3% |
| Standard Deviation (Population) | 3.5% | 1.3% |
Similar Demographics by Self-Care Disability
Demographics Similar to Immigrants from Fiji by Self-Care Disability
In terms of self-care disability, the demographic groups most similar to Immigrants from Fiji are Pima (2.8%, a difference of 0.090%), Immigrants from St. Vincent and the Grenadines (2.8%, a difference of 0.13%), Immigrants from Belize (2.8%, a difference of 0.28%), Cree (2.8%, a difference of 0.43%), and Immigrants from Guyana (2.8%, a difference of 0.47%).
| Demographics | Rating | Rank | Self-Care Disability |
| Belizeans | 0.0 /100 | #293 | Tragic 2.7% |
| Blackfeet | 0.0 /100 | #294 | Tragic 2.7% |
| Barbadians | 0.0 /100 | #295 | Tragic 2.7% |
| Immigrants | Portugal | 0.0 /100 | #296 | Tragic 2.8% |
| West Indians | 0.0 /100 | #297 | Tragic 2.8% |
| Americans | 0.0 /100 | #298 | Tragic 2.8% |
| Immigrants | Guyana | 0.0 /100 | #299 | Tragic 2.8% |
| Immigrants | Fiji | 0.0 /100 | #300 | Tragic 2.8% |
| Pima | 0.0 /100 | #301 | Tragic 2.8% |
| Immigrants | St. Vincent and the Grenadines | 0.0 /100 | #302 | Tragic 2.8% |
| Immigrants | Belize | 0.0 /100 | #303 | Tragic 2.8% |
| Cree | 0.0 /100 | #304 | Tragic 2.8% |
| Immigrants | West Indies | 0.0 /100 | #305 | Tragic 2.8% |
| Aleuts | 0.0 /100 | #306 | Tragic 2.8% |
| Natives/Alaskans | 0.0 /100 | #307 | Tragic 2.8% |
Demographics Similar to Venezuelans by Self-Care Disability
In terms of self-care disability, the demographic groups most similar to Venezuelans are Immigrants from Sri Lanka (2.2%, a difference of 0.010%), Turkish (2.2%, a difference of 0.080%), Inupiat (2.2%, a difference of 0.16%), Cypriot (2.2%, a difference of 0.19%), and Immigrants from Zimbabwe (2.3%, a difference of 0.25%).
| Demographics | Rating | Rank | Self-Care Disability |
| Tongans | 100.0 /100 | #20 | Exceptional 2.2% |
| Bulgarians | 100.0 /100 | #21 | Exceptional 2.2% |
| Immigrants | Venezuela | 100.0 /100 | #22 | Exceptional 2.2% |
| Cambodians | 100.0 /100 | #23 | Exceptional 2.2% |
| Cypriots | 100.0 /100 | #24 | Exceptional 2.2% |
| Turks | 100.0 /100 | #25 | Exceptional 2.2% |
| Immigrants | Sri Lanka | 99.9 /100 | #26 | Exceptional 2.2% |
| Venezuelans | 99.9 /100 | #27 | Exceptional 2.2% |
| Inupiat | 99.9 /100 | #28 | Exceptional 2.2% |
| Immigrants | Zimbabwe | 99.9 /100 | #29 | Exceptional 2.3% |
| Paraguayans | 99.9 /100 | #30 | Exceptional 2.3% |
| Danes | 99.9 /100 | #31 | Exceptional 2.3% |
| Burmese | 99.9 /100 | #32 | Exceptional 2.3% |
| Immigrants | Korea | 99.9 /100 | #33 | Exceptional 2.3% |
| Immigrants | Turkey | 99.9 /100 | #34 | Exceptional 2.3% |