Menominee vs Mexican Self-Care Disability
COMPARE
Menominee
Mexican
Self-Care Disability
Self-Care Disability Comparison
Menominee
Mexicans
2.8%
SELF-CARE DISABILITY
0.0/ 100
METRIC RATING
316th/ 347
METRIC RANK
2.7%
SELF-CARE DISABILITY
0.1/ 100
METRIC RATING
273rd/ 347
METRIC RANK
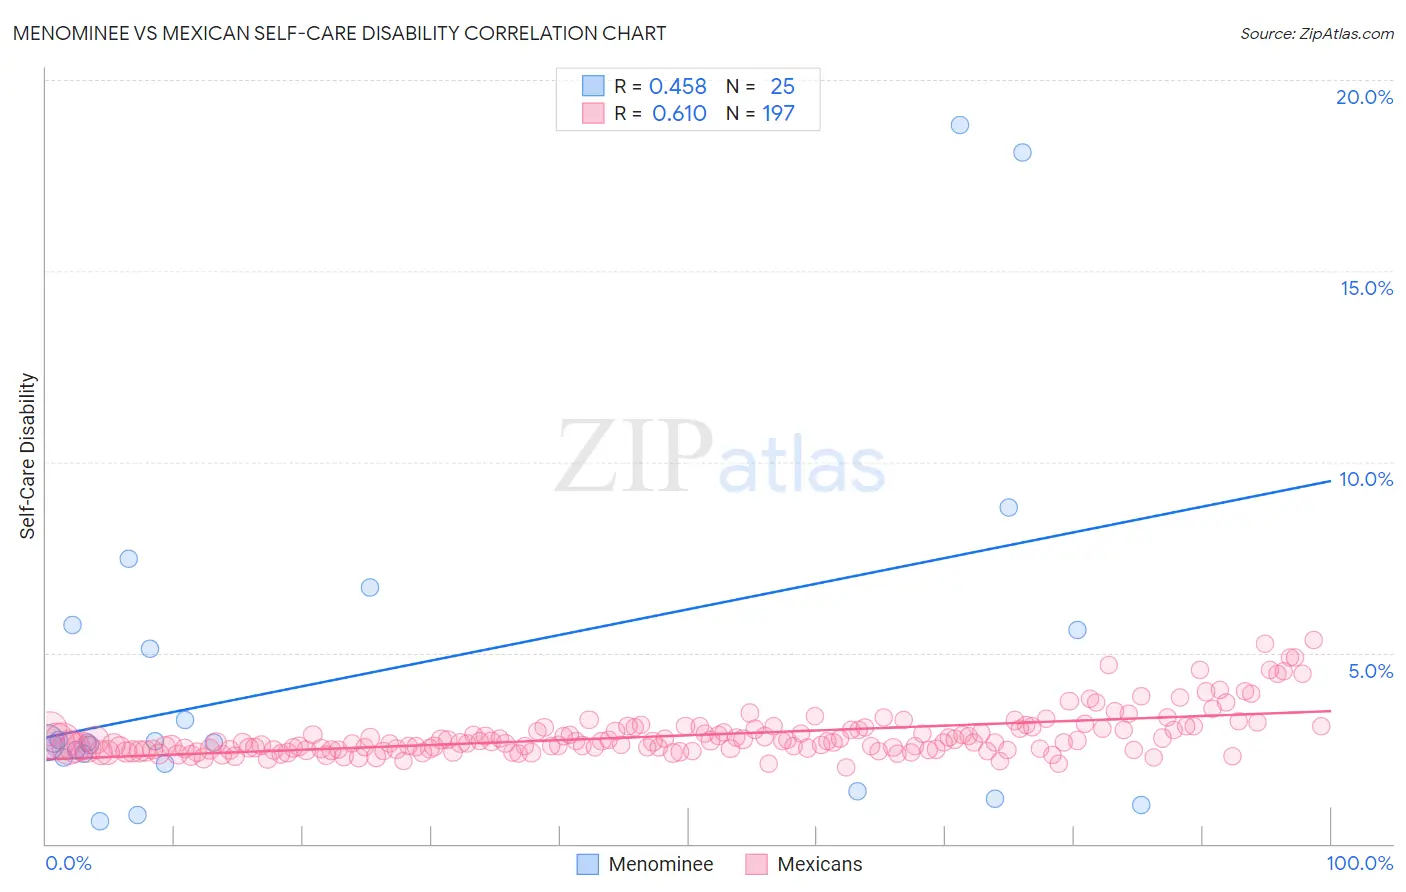
Menominee vs Mexican Self-Care Disability Correlation Chart
The statistical analysis conducted on geographies consisting of 45,776,619 people shows a moderate positive correlation between the proportion of Menominee and percentage of population with self-care disability in the United States with a correlation coefficient (R) of 0.458 and weighted average of 2.8%. Similarly, the statistical analysis conducted on geographies consisting of 563,049,002 people shows a significant positive correlation between the proportion of Mexicans and percentage of population with self-care disability in the United States with a correlation coefficient (R) of 0.610 and weighted average of 2.7%, a difference of 6.3%.
Self-Care Disability Correlation Summary
| Measurement | Menominee | Mexican |
| Minimum | 0.59% | 2.0% |
| Maximum | 18.8% | 5.3% |
| Range | 18.2% | 3.3% |
| Mean | 4.5% | 2.8% |
| Median | 2.6% | 2.7% |
| Interquartile 25% (IQ1) | 2.2% | 2.5% |
| Interquartile 75% (IQ3) | 5.7% | 3.0% |
| Interquartile Range (IQR) | 3.5% | 0.54% |
| Standard Deviation (Sample) | 4.7% | 0.59% |
| Standard Deviation (Population) | 4.6% | 0.59% |
Similar Demographics by Self-Care Disability
Demographics Similar to Menominee by Self-Care Disability
In terms of self-care disability, the demographic groups most similar to Menominee are Immigrants from Cuba (2.8%, a difference of 0.10%), Immigrants from Dominica (2.8%, a difference of 0.13%), Assyrian/Chaldean/Syriac (2.8%, a difference of 0.14%), Spanish American Indian (2.9%, a difference of 0.29%), and Creek (2.8%, a difference of 0.32%).
| Demographics | Rating | Rank | Self-Care Disability |
| Bangladeshis | 0.0 /100 | #309 | Tragic 2.8% |
| British West Indians | 0.0 /100 | #310 | Tragic 2.8% |
| Puget Sound Salish | 0.0 /100 | #311 | Tragic 2.8% |
| Immigrants | Caribbean | 0.0 /100 | #312 | Tragic 2.8% |
| Spanish Americans | 0.0 /100 | #313 | Tragic 2.8% |
| Creek | 0.0 /100 | #314 | Tragic 2.8% |
| Immigrants | Cuba | 0.0 /100 | #315 | Tragic 2.8% |
| Menominee | 0.0 /100 | #316 | Tragic 2.8% |
| Immigrants | Dominica | 0.0 /100 | #317 | Tragic 2.8% |
| Assyrians/Chaldeans/Syriacs | 0.0 /100 | #318 | Tragic 2.8% |
| Spanish American Indians | 0.0 /100 | #319 | Tragic 2.9% |
| Chickasaw | 0.0 /100 | #320 | Tragic 2.9% |
| Navajo | 0.0 /100 | #321 | Tragic 2.9% |
| Comanche | 0.0 /100 | #322 | Tragic 2.9% |
| Seminole | 0.0 /100 | #323 | Tragic 2.9% |
Demographics Similar to Mexicans by Self-Care Disability
In terms of self-care disability, the demographic groups most similar to Mexicans are Yakama (2.7%, a difference of 0.060%), Immigrants from Trinidad and Tobago (2.7%, a difference of 0.060%), Immigrants from Laos (2.7%, a difference of 0.13%), Trinidadian and Tobagonian (2.7%, a difference of 0.18%), and Japanese (2.7%, a difference of 0.19%).
| Demographics | Rating | Rank | Self-Care Disability |
| Immigrants | Cambodia | 0.1 /100 | #266 | Tragic 2.7% |
| Yaqui | 0.1 /100 | #267 | Tragic 2.7% |
| Immigrants | Mexico | 0.1 /100 | #268 | Tragic 2.7% |
| U.S. Virgin Islanders | 0.1 /100 | #269 | Tragic 2.7% |
| Immigrants | Micronesia | 0.1 /100 | #270 | Tragic 2.7% |
| Trinidadians and Tobagonians | 0.1 /100 | #271 | Tragic 2.7% |
| Immigrants | Laos | 0.1 /100 | #272 | Tragic 2.7% |
| Mexicans | 0.1 /100 | #273 | Tragic 2.7% |
| Yakama | 0.1 /100 | #274 | Tragic 2.7% |
| Immigrants | Trinidad and Tobago | 0.1 /100 | #275 | Tragic 2.7% |
| Japanese | 0.1 /100 | #276 | Tragic 2.7% |
| Immigrants | Ukraine | 0.1 /100 | #277 | Tragic 2.7% |
| Ottawa | 0.1 /100 | #278 | Tragic 2.7% |
| Iroquois | 0.1 /100 | #279 | Tragic 2.7% |
| Hispanics or Latinos | 0.1 /100 | #280 | Tragic 2.7% |