Austrian vs Mexican Self-Care Disability
COMPARE
Austrian
Mexican
Self-Care Disability
Self-Care Disability Comparison
Austrians
Mexicans
2.4%
SELF-CARE DISABILITY
87.0/ 100
METRIC RATING
137th/ 347
METRIC RANK
2.7%
SELF-CARE DISABILITY
0.1/ 100
METRIC RATING
273rd/ 347
METRIC RANK
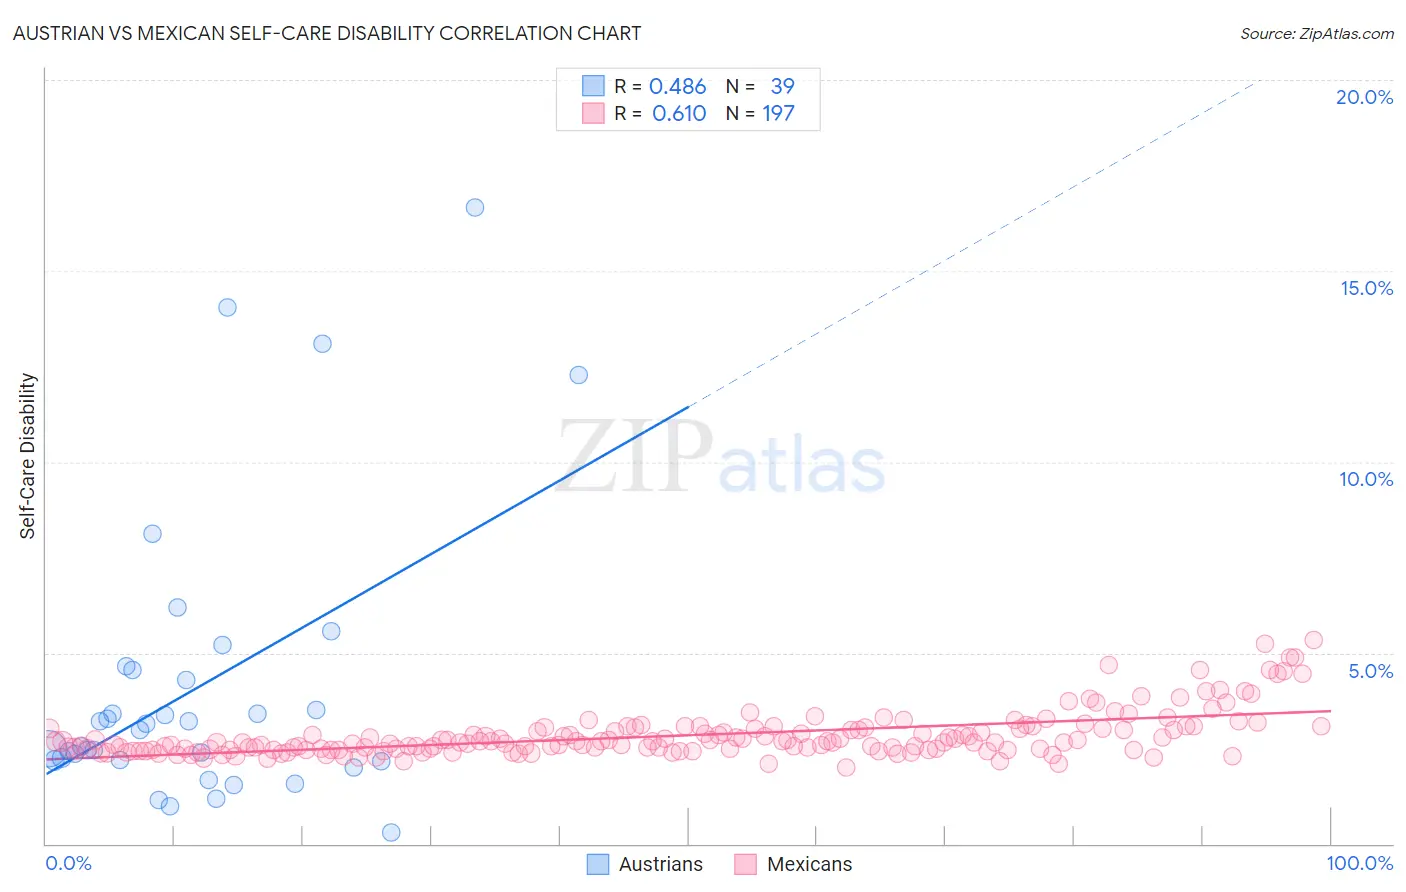
Austrian vs Mexican Self-Care Disability Correlation Chart
The statistical analysis conducted on geographies consisting of 451,319,038 people shows a moderate positive correlation between the proportion of Austrians and percentage of population with self-care disability in the United States with a correlation coefficient (R) of 0.486 and weighted average of 2.4%. Similarly, the statistical analysis conducted on geographies consisting of 563,049,002 people shows a significant positive correlation between the proportion of Mexicans and percentage of population with self-care disability in the United States with a correlation coefficient (R) of 0.610 and weighted average of 2.7%, a difference of 11.0%.
Self-Care Disability Correlation Summary
| Measurement | Austrian | Mexican |
| Minimum | 0.31% | 2.0% |
| Maximum | 16.7% | 5.3% |
| Range | 16.4% | 3.3% |
| Mean | 4.1% | 2.8% |
| Median | 3.0% | 2.7% |
| Interquartile 25% (IQ1) | 2.2% | 2.5% |
| Interquartile 75% (IQ3) | 4.6% | 3.0% |
| Interquartile Range (IQR) | 2.4% | 0.54% |
| Standard Deviation (Sample) | 3.7% | 0.59% |
| Standard Deviation (Population) | 3.7% | 0.59% |
Similar Demographics by Self-Care Disability
Demographics Similar to Austrians by Self-Care Disability
In terms of self-care disability, the demographic groups most similar to Austrians are South American Indian (2.4%, a difference of 0.020%), Immigrants from Croatia (2.4%, a difference of 0.050%), Sri Lankan (2.4%, a difference of 0.050%), Laotian (2.4%, a difference of 0.080%), and Russian (2.4%, a difference of 0.14%).
| Demographics | Rating | Rank | Self-Care Disability |
| Immigrants | Austria | 89.0 /100 | #130 | Excellent 2.4% |
| Poles | 88.9 /100 | #131 | Excellent 2.4% |
| Immigrants | South America | 88.8 /100 | #132 | Excellent 2.4% |
| Immigrants | Colombia | 88.5 /100 | #133 | Excellent 2.4% |
| Russians | 88.2 /100 | #134 | Excellent 2.4% |
| Laotians | 87.8 /100 | #135 | Excellent 2.4% |
| South American Indians | 87.2 /100 | #136 | Excellent 2.4% |
| Austrians | 87.0 /100 | #137 | Excellent 2.4% |
| Immigrants | Croatia | 86.6 /100 | #138 | Excellent 2.4% |
| Sri Lankans | 86.6 /100 | #139 | Excellent 2.4% |
| Immigrants | Uruguay | 85.4 /100 | #140 | Excellent 2.4% |
| Alaska Natives | 84.5 /100 | #141 | Excellent 2.4% |
| Immigrants | Peru | 83.2 /100 | #142 | Excellent 2.4% |
| Afghans | 82.3 /100 | #143 | Excellent 2.4% |
| Costa Ricans | 80.8 /100 | #144 | Excellent 2.4% |
Demographics Similar to Mexicans by Self-Care Disability
In terms of self-care disability, the demographic groups most similar to Mexicans are Yakama (2.7%, a difference of 0.060%), Immigrants from Trinidad and Tobago (2.7%, a difference of 0.060%), Immigrants from Laos (2.7%, a difference of 0.13%), Trinidadian and Tobagonian (2.7%, a difference of 0.18%), and Japanese (2.7%, a difference of 0.19%).
| Demographics | Rating | Rank | Self-Care Disability |
| Immigrants | Cambodia | 0.1 /100 | #266 | Tragic 2.7% |
| Yaqui | 0.1 /100 | #267 | Tragic 2.7% |
| Immigrants | Mexico | 0.1 /100 | #268 | Tragic 2.7% |
| U.S. Virgin Islanders | 0.1 /100 | #269 | Tragic 2.7% |
| Immigrants | Micronesia | 0.1 /100 | #270 | Tragic 2.7% |
| Trinidadians and Tobagonians | 0.1 /100 | #271 | Tragic 2.7% |
| Immigrants | Laos | 0.1 /100 | #272 | Tragic 2.7% |
| Mexicans | 0.1 /100 | #273 | Tragic 2.7% |
| Yakama | 0.1 /100 | #274 | Tragic 2.7% |
| Immigrants | Trinidad and Tobago | 0.1 /100 | #275 | Tragic 2.7% |
| Japanese | 0.1 /100 | #276 | Tragic 2.7% |
| Immigrants | Ukraine | 0.1 /100 | #277 | Tragic 2.7% |
| Ottawa | 0.1 /100 | #278 | Tragic 2.7% |
| Iroquois | 0.1 /100 | #279 | Tragic 2.7% |
| Hispanics or Latinos | 0.1 /100 | #280 | Tragic 2.7% |