Immigrants from Fiji vs Immigrants from Belize Disability
COMPARE
Immigrants from Fiji
Immigrants from Belize
Disability
Disability Comparison
Immigrants from Fiji
Immigrants from Belize
11.6%
DISABILITY
69.5/ 100
METRIC RATING
156th/ 347
METRIC RANK
11.9%
DISABILITY
15.2/ 100
METRIC RATING
197th/ 347
METRIC RANK
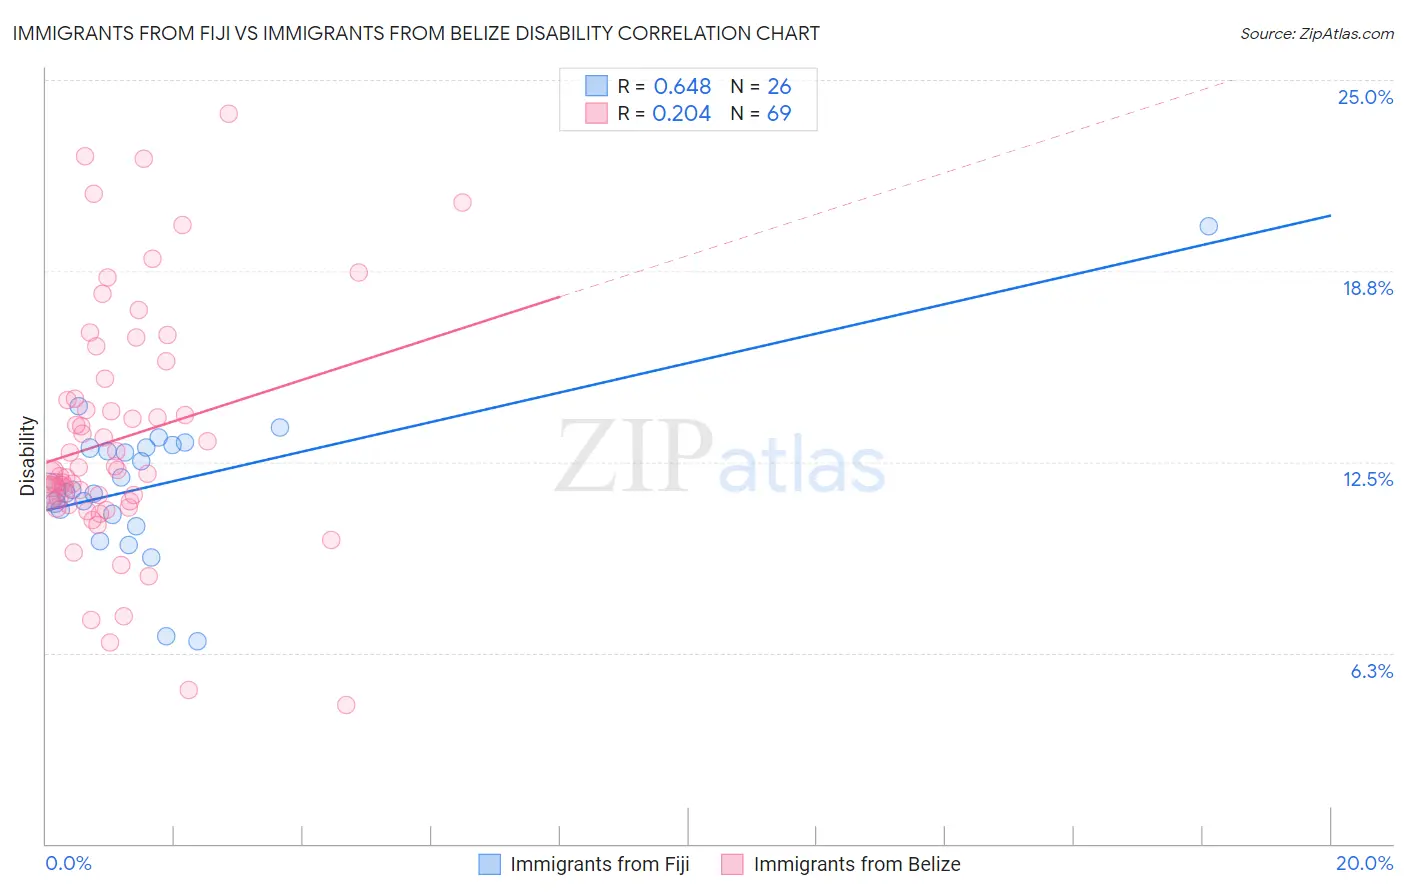
Immigrants from Fiji vs Immigrants from Belize Disability Correlation Chart
The statistical analysis conducted on geographies consisting of 93,755,847 people shows a significant positive correlation between the proportion of Immigrants from Fiji and percentage of population with a disability in the United States with a correlation coefficient (R) of 0.648 and weighted average of 11.6%. Similarly, the statistical analysis conducted on geographies consisting of 130,304,390 people shows a weak positive correlation between the proportion of Immigrants from Belize and percentage of population with a disability in the United States with a correlation coefficient (R) of 0.204 and weighted average of 11.9%, a difference of 2.8%.
Disability Correlation Summary
| Measurement | Immigrants from Fiji | Immigrants from Belize |
| Minimum | 6.6% | 4.5% |
| Maximum | 20.2% | 23.9% |
| Range | 13.6% | 19.4% |
| Mean | 11.8% | 13.3% |
| Median | 11.6% | 12.2% |
| Interquartile 25% (IQ1) | 10.8% | 11.2% |
| Interquartile 75% (IQ3) | 13.0% | 14.9% |
| Interquartile Range (IQR) | 2.2% | 3.8% |
| Standard Deviation (Sample) | 2.5% | 4.0% |
| Standard Deviation (Population) | 2.5% | 3.9% |
Similar Demographics by Disability
Demographics Similar to Immigrants from Fiji by Disability
In terms of disability, the demographic groups most similar to Immigrants from Fiji are Immigrants from Middle Africa (11.6%, a difference of 0.0%), Immigrants from Netherlands (11.6%, a difference of 0.010%), Immigrants from Ghana (11.6%, a difference of 0.090%), Immigrants from Guatemala (11.6%, a difference of 0.090%), and Immigrants from Kenya (11.6%, a difference of 0.14%).
| Demographics | Rating | Rank | Disability |
| Immigrants | Norway | 73.2 /100 | #149 | Good 11.6% |
| Romanians | 72.7 /100 | #150 | Good 11.6% |
| Immigrants | Kenya | 72.1 /100 | #151 | Good 11.6% |
| Immigrants | Moldova | 72.0 /100 | #152 | Good 11.6% |
| Immigrants | Ghana | 71.2 /100 | #153 | Good 11.6% |
| Immigrants | Guatemala | 71.1 /100 | #154 | Good 11.6% |
| Immigrants | Netherlands | 69.8 /100 | #155 | Good 11.6% |
| Immigrants | Fiji | 69.5 /100 | #156 | Good 11.6% |
| Immigrants | Middle Africa | 69.5 /100 | #157 | Good 11.6% |
| Armenians | 65.9 /100 | #158 | Good 11.6% |
| Guatemalans | 65.1 /100 | #159 | Good 11.6% |
| Immigrants | Barbados | 64.2 /100 | #160 | Good 11.6% |
| Immigrants | Cuba | 62.8 /100 | #161 | Good 11.6% |
| Immigrants | Haiti | 59.2 /100 | #162 | Average 11.7% |
| Immigrants | Trinidad and Tobago | 58.9 /100 | #163 | Average 11.7% |
Demographics Similar to Immigrants from Belize by Disability
In terms of disability, the demographic groups most similar to Immigrants from Belize are Serbian (11.9%, a difference of 0.010%), Barbadian (11.9%, a difference of 0.050%), Ukrainian (11.9%, a difference of 0.050%), Immigrants from Panama (11.9%, a difference of 0.050%), and Somali (11.9%, a difference of 0.17%).
| Demographics | Rating | Rank | Disability |
| Immigrants | West Indies | 21.1 /100 | #190 | Fair 11.9% |
| Ute | 19.5 /100 | #191 | Poor 11.9% |
| Lithuanians | 18.8 /100 | #192 | Poor 11.9% |
| Immigrants | Bosnia and Herzegovina | 18.0 /100 | #193 | Poor 11.9% |
| Somalis | 17.3 /100 | #194 | Poor 11.9% |
| Barbadians | 15.8 /100 | #195 | Poor 11.9% |
| Serbians | 15.4 /100 | #196 | Poor 11.9% |
| Immigrants | Belize | 15.2 /100 | #197 | Poor 11.9% |
| Ukrainians | 14.7 /100 | #198 | Poor 11.9% |
| Immigrants | Panama | 14.6 /100 | #199 | Poor 11.9% |
| Belizeans | 12.8 /100 | #200 | Poor 11.9% |
| Assyrians/Chaldeans/Syriacs | 12.6 /100 | #201 | Poor 11.9% |
| Immigrants | England | 12.0 /100 | #202 | Poor 12.0% |
| British West Indians | 11.5 /100 | #203 | Poor 12.0% |
| Mexican American Indians | 11.4 /100 | #204 | Poor 12.0% |