Immigrants from Fiji vs Immigrants from Latvia Disability
COMPARE
Immigrants from Fiji
Immigrants from Latvia
Disability
Disability Comparison
Immigrants from Fiji
Immigrants from Latvia
11.6%
DISABILITY
69.5/ 100
METRIC RATING
156th/ 347
METRIC RANK
11.4%
DISABILITY
90.9/ 100
METRIC RATING
126th/ 347
METRIC RANK
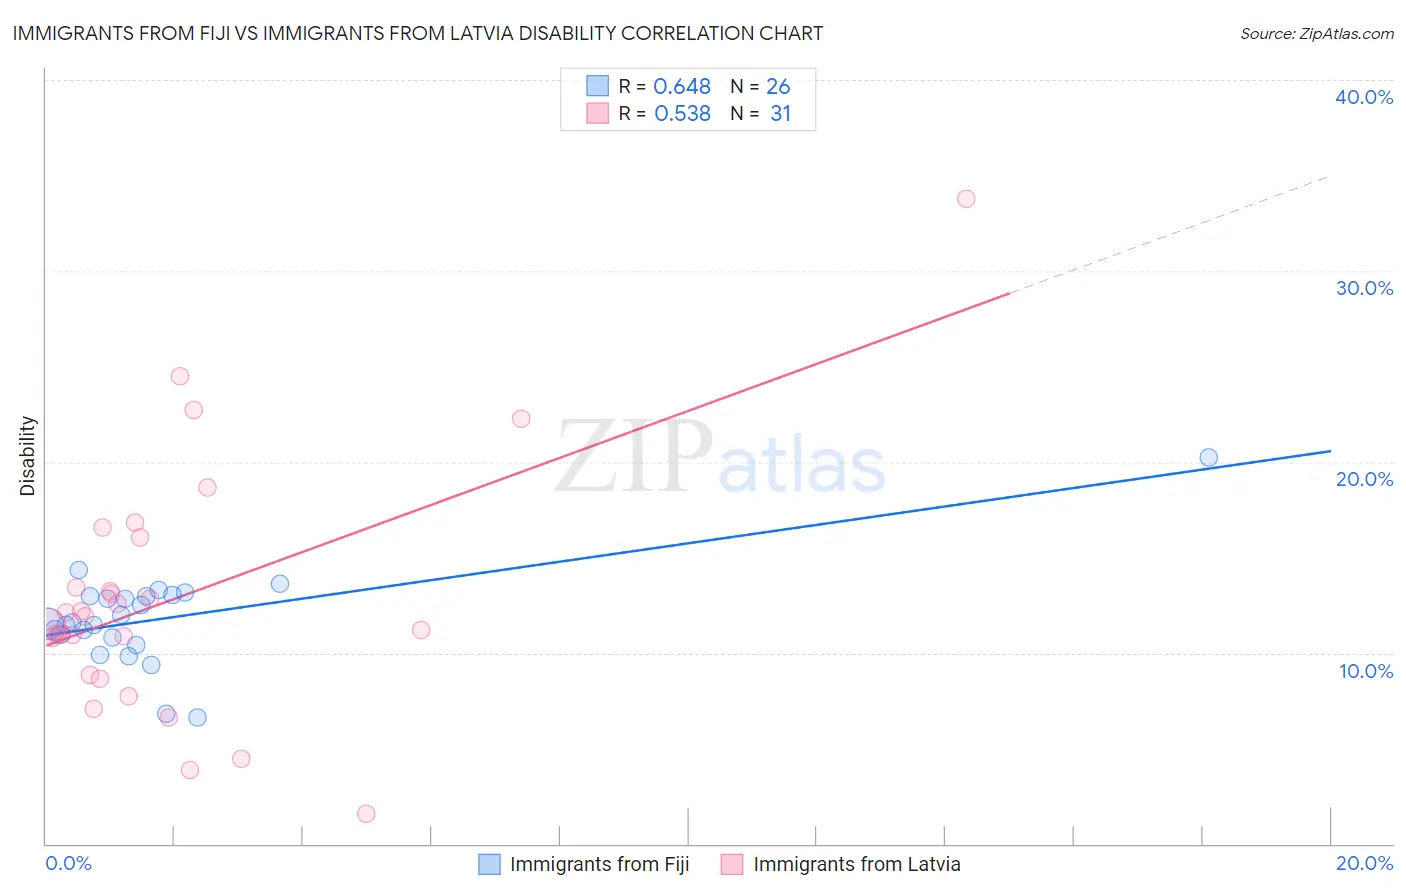
Immigrants from Fiji vs Immigrants from Latvia Disability Correlation Chart
The statistical analysis conducted on geographies consisting of 93,755,847 people shows a significant positive correlation between the proportion of Immigrants from Fiji and percentage of population with a disability in the United States with a correlation coefficient (R) of 0.648 and weighted average of 11.6%. Similarly, the statistical analysis conducted on geographies consisting of 113,739,259 people shows a substantial positive correlation between the proportion of Immigrants from Latvia and percentage of population with a disability in the United States with a correlation coefficient (R) of 0.538 and weighted average of 11.4%, a difference of 1.7%.
Disability Correlation Summary
| Measurement | Immigrants from Fiji | Immigrants from Latvia |
| Minimum | 6.6% | 1.5% |
| Maximum | 20.2% | 33.8% |
| Range | 13.6% | 32.2% |
| Mean | 11.8% | 12.9% |
| Median | 11.6% | 11.9% |
| Interquartile 25% (IQ1) | 10.8% | 8.8% |
| Interquartile 75% (IQ3) | 13.0% | 16.0% |
| Interquartile Range (IQR) | 2.2% | 7.2% |
| Standard Deviation (Sample) | 2.5% | 6.5% |
| Standard Deviation (Population) | 2.5% | 6.4% |
Similar Demographics by Disability
Demographics Similar to Immigrants from Fiji by Disability
In terms of disability, the demographic groups most similar to Immigrants from Fiji are Immigrants from Middle Africa (11.6%, a difference of 0.0%), Immigrants from Netherlands (11.6%, a difference of 0.010%), Immigrants from Ghana (11.6%, a difference of 0.090%), Immigrants from Guatemala (11.6%, a difference of 0.090%), and Immigrants from Kenya (11.6%, a difference of 0.14%).
| Demographics | Rating | Rank | Disability |
| Immigrants | Norway | 73.2 /100 | #149 | Good 11.6% |
| Romanians | 72.7 /100 | #150 | Good 11.6% |
| Immigrants | Kenya | 72.1 /100 | #151 | Good 11.6% |
| Immigrants | Moldova | 72.0 /100 | #152 | Good 11.6% |
| Immigrants | Ghana | 71.2 /100 | #153 | Good 11.6% |
| Immigrants | Guatemala | 71.1 /100 | #154 | Good 11.6% |
| Immigrants | Netherlands | 69.8 /100 | #155 | Good 11.6% |
| Immigrants | Fiji | 69.5 /100 | #156 | Good 11.6% |
| Immigrants | Middle Africa | 69.5 /100 | #157 | Good 11.6% |
| Armenians | 65.9 /100 | #158 | Good 11.6% |
| Guatemalans | 65.1 /100 | #159 | Good 11.6% |
| Immigrants | Barbados | 64.2 /100 | #160 | Good 11.6% |
| Immigrants | Cuba | 62.8 /100 | #161 | Good 11.6% |
| Immigrants | Haiti | 59.2 /100 | #162 | Average 11.7% |
| Immigrants | Trinidad and Tobago | 58.9 /100 | #163 | Average 11.7% |
Demographics Similar to Immigrants from Latvia by Disability
In terms of disability, the demographic groups most similar to Immigrants from Latvia are Immigrants from Italy (11.4%, a difference of 0.070%), Immigrants from Europe (11.4%, a difference of 0.070%), Macedonian (11.4%, a difference of 0.080%), Latvian (11.4%, a difference of 0.14%), and Costa Rican (11.4%, a difference of 0.15%).
| Demographics | Rating | Rank | Disability |
| Central Americans | 93.5 /100 | #119 | Exceptional 11.4% |
| Immigrants | North Macedonia | 93.5 /100 | #120 | Exceptional 11.4% |
| Immigrants | Costa Rica | 93.4 /100 | #121 | Exceptional 11.4% |
| Brazilians | 93.3 /100 | #122 | Exceptional 11.4% |
| South Africans | 92.3 /100 | #123 | Exceptional 11.4% |
| South American Indians | 92.2 /100 | #124 | Exceptional 11.4% |
| Costa Ricans | 91.9 /100 | #125 | Exceptional 11.4% |
| Immigrants | Latvia | 90.9 /100 | #126 | Exceptional 11.4% |
| Immigrants | Italy | 90.4 /100 | #127 | Exceptional 11.4% |
| Immigrants | Europe | 90.4 /100 | #128 | Exceptional 11.4% |
| Macedonians | 90.3 /100 | #129 | Exceptional 11.4% |
| Latvians | 89.8 /100 | #130 | Excellent 11.4% |
| Immigrants | Croatia | 89.8 /100 | #131 | Excellent 11.4% |
| Immigrants | Africa | 89.3 /100 | #132 | Excellent 11.4% |
| Arabs | 89.1 /100 | #133 | Excellent 11.4% |