Immigrants from Fiji vs French Male Disability
COMPARE
Immigrants from Fiji
French
Male Disability
Male Disability Comparison
Immigrants from Fiji
French
11.0%
MALE DISABILITY
84.0/ 100
METRIC RATING
132nd/ 347
METRIC RANK
13.0%
MALE DISABILITY
0.0/ 100
METRIC RATING
301st/ 347
METRIC RANK
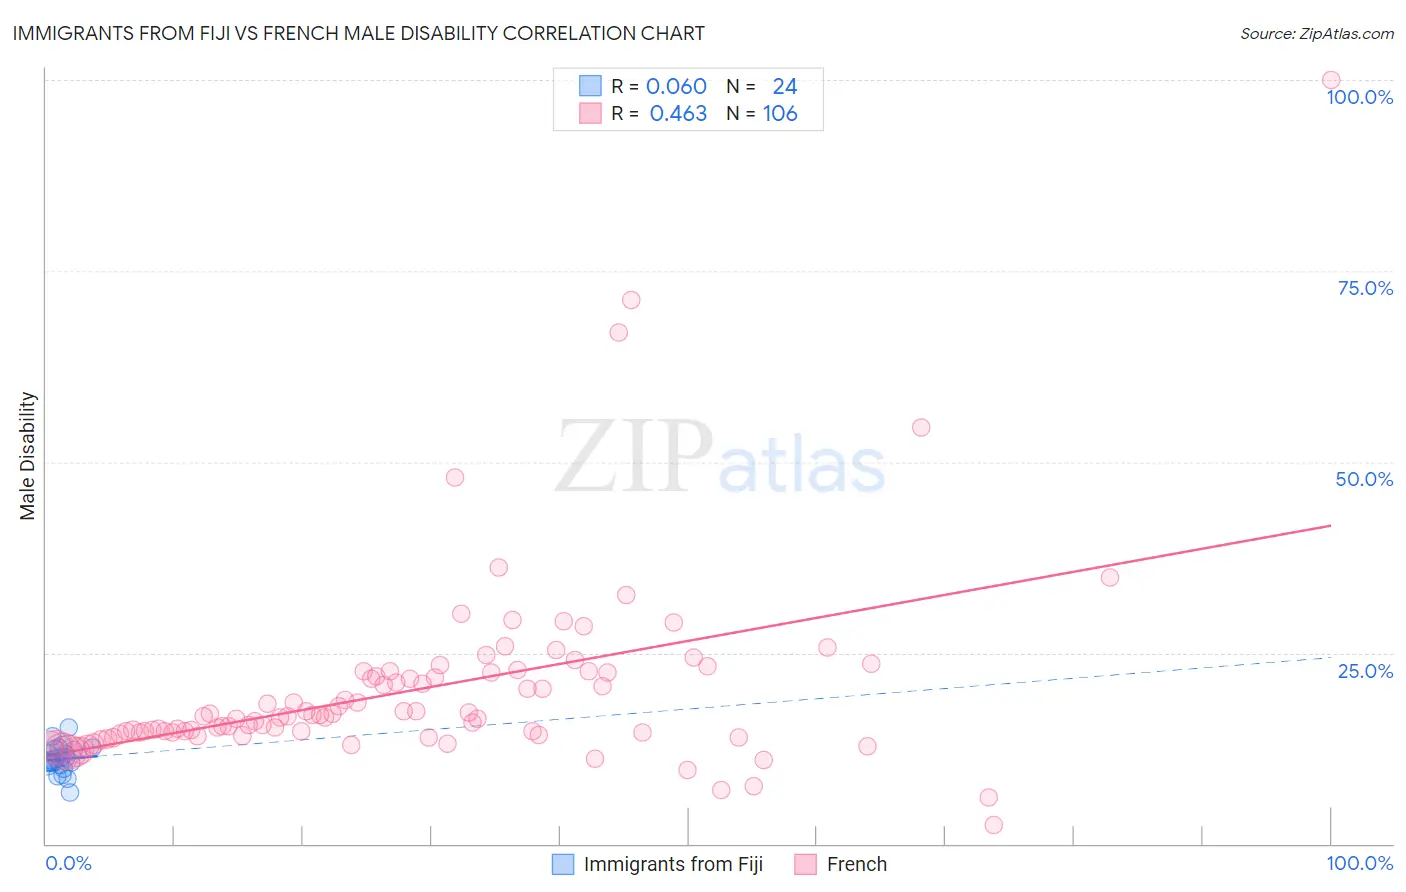
Immigrants from Fiji vs French Male Disability Correlation Chart
The statistical analysis conducted on geographies consisting of 93,755,192 people shows a slight positive correlation between the proportion of Immigrants from Fiji and percentage of males with a disability in the United States with a correlation coefficient (R) of 0.060 and weighted average of 11.0%. Similarly, the statistical analysis conducted on geographies consisting of 572,141,225 people shows a moderate positive correlation between the proportion of French and percentage of males with a disability in the United States with a correlation coefficient (R) of 0.463 and weighted average of 13.0%, a difference of 19.0%.
Male Disability Correlation Summary
| Measurement | Immigrants from Fiji | French |
| Minimum | 6.7% | 2.5% |
| Maximum | 15.2% | 100.0% |
| Range | 8.5% | 97.5% |
| Mean | 11.1% | 20.1% |
| Median | 11.0% | 16.6% |
| Interquartile 25% (IQ1) | 10.4% | 14.3% |
| Interquartile 75% (IQ3) | 12.4% | 22.4% |
| Interquartile Range (IQR) | 1.9% | 8.1% |
| Standard Deviation (Sample) | 1.8% | 12.8% |
| Standard Deviation (Population) | 1.8% | 12.8% |
Similar Demographics by Male Disability
Demographics Similar to Immigrants from Fiji by Male Disability
In terms of male disability, the demographic groups most similar to Immigrants from Fiji are Ugandan (11.0%, a difference of 0.010%), Macedonian (11.0%, a difference of 0.020%), Bhutanese (11.0%, a difference of 0.070%), Trinidadian and Tobagonian (11.0%, a difference of 0.080%), and Immigrants from Costa Rica (11.0%, a difference of 0.13%).
| Demographics | Rating | Rank | Male Disability |
| Immigrants | North Macedonia | 88.1 /100 | #125 | Excellent 10.9% |
| Immigrants | Trinidad and Tobago | 86.9 /100 | #126 | Excellent 10.9% |
| Immigrants | Ukraine | 86.8 /100 | #127 | Excellent 10.9% |
| Immigrants | Latvia | 85.5 /100 | #128 | Excellent 10.9% |
| Immigrants | Philippines | 85.4 /100 | #129 | Excellent 10.9% |
| Brazilians | 85.4 /100 | #130 | Excellent 10.9% |
| Macedonians | 84.2 /100 | #131 | Excellent 11.0% |
| Immigrants | Fiji | 84.0 /100 | #132 | Excellent 11.0% |
| Ugandans | 83.9 /100 | #133 | Excellent 11.0% |
| Bhutanese | 83.4 /100 | #134 | Excellent 11.0% |
| Trinidadians and Tobagonians | 83.3 /100 | #135 | Excellent 11.0% |
| Immigrants | Costa Rica | 82.8 /100 | #136 | Excellent 11.0% |
| Immigrants | Europe | 82.0 /100 | #137 | Excellent 11.0% |
| Nigerians | 81.9 /100 | #138 | Excellent 11.0% |
| South Africans | 81.7 /100 | #139 | Excellent 11.0% |
Demographics Similar to French by Male Disability
In terms of male disability, the demographic groups most similar to French are Cheyenne (13.0%, a difference of 0.040%), Celtic (13.0%, a difference of 0.13%), Pennsylvania German (13.0%, a difference of 0.48%), Crow (13.1%, a difference of 0.58%), and Inupiat (13.0%, a difference of 0.69%).
| Demographics | Rating | Rank | Male Disability |
| Marshallese | 0.0 /100 | #294 | Tragic 12.9% |
| Immigrants | Micronesia | 0.0 /100 | #295 | Tragic 12.9% |
| Immigrants | Nonimmigrants | 0.0 /100 | #296 | Tragic 12.9% |
| Inupiat | 0.0 /100 | #297 | Tragic 13.0% |
| Pennsylvania Germans | 0.0 /100 | #298 | Tragic 13.0% |
| Celtics | 0.0 /100 | #299 | Tragic 13.0% |
| Cheyenne | 0.0 /100 | #300 | Tragic 13.0% |
| French | 0.0 /100 | #301 | Tragic 13.0% |
| Crow | 0.0 /100 | #302 | Tragic 13.1% |
| Scotch-Irish | 0.0 /100 | #303 | Tragic 13.2% |
| Blacks/African Americans | 0.0 /100 | #304 | Tragic 13.2% |
| French Canadians | 0.0 /100 | #305 | Tragic 13.3% |
| Spanish Americans | 0.0 /100 | #306 | Tragic 13.3% |
| Arapaho | 0.0 /100 | #307 | Tragic 13.3% |
| French American Indians | 0.0 /100 | #308 | Tragic 13.4% |