Immigrants from Fiji vs Central American Indian Male Disability
COMPARE
Immigrants from Fiji
Central American Indian
Male Disability
Male Disability Comparison
Immigrants from Fiji
Central American Indians
11.0%
MALE DISABILITY
84.0/ 100
METRIC RATING
132nd/ 347
METRIC RANK
12.7%
MALE DISABILITY
0.0/ 100
METRIC RATING
278th/ 347
METRIC RANK
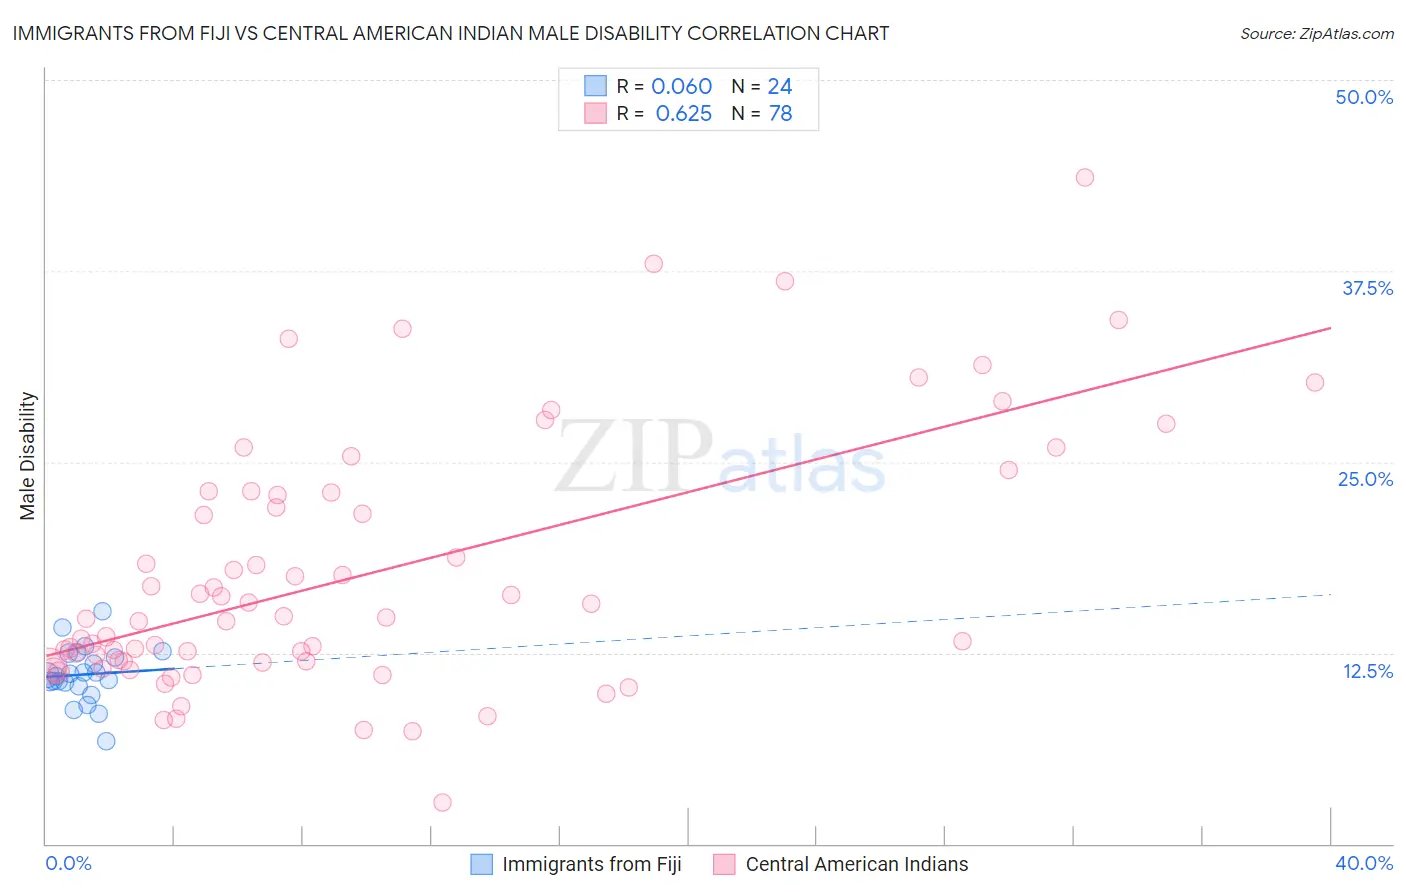
Immigrants from Fiji vs Central American Indian Male Disability Correlation Chart
The statistical analysis conducted on geographies consisting of 93,755,192 people shows a slight positive correlation between the proportion of Immigrants from Fiji and percentage of males with a disability in the United States with a correlation coefficient (R) of 0.060 and weighted average of 11.0%. Similarly, the statistical analysis conducted on geographies consisting of 326,112,546 people shows a significant positive correlation between the proportion of Central American Indians and percentage of males with a disability in the United States with a correlation coefficient (R) of 0.625 and weighted average of 12.7%, a difference of 15.6%.
Male Disability Correlation Summary
| Measurement | Immigrants from Fiji | Central American Indian |
| Minimum | 6.7% | 2.7% |
| Maximum | 15.2% | 43.7% |
| Range | 8.5% | 40.9% |
| Mean | 11.1% | 17.7% |
| Median | 11.0% | 14.8% |
| Interquartile 25% (IQ1) | 10.4% | 11.9% |
| Interquartile 75% (IQ3) | 12.4% | 23.0% |
| Interquartile Range (IQR) | 1.9% | 11.0% |
| Standard Deviation (Sample) | 1.8% | 8.4% |
| Standard Deviation (Population) | 1.8% | 8.3% |
Similar Demographics by Male Disability
Demographics Similar to Immigrants from Fiji by Male Disability
In terms of male disability, the demographic groups most similar to Immigrants from Fiji are Ugandan (11.0%, a difference of 0.010%), Macedonian (11.0%, a difference of 0.020%), Bhutanese (11.0%, a difference of 0.070%), Trinidadian and Tobagonian (11.0%, a difference of 0.080%), and Immigrants from Costa Rica (11.0%, a difference of 0.13%).
| Demographics | Rating | Rank | Male Disability |
| Immigrants | North Macedonia | 88.1 /100 | #125 | Excellent 10.9% |
| Immigrants | Trinidad and Tobago | 86.9 /100 | #126 | Excellent 10.9% |
| Immigrants | Ukraine | 86.8 /100 | #127 | Excellent 10.9% |
| Immigrants | Latvia | 85.5 /100 | #128 | Excellent 10.9% |
| Immigrants | Philippines | 85.4 /100 | #129 | Excellent 10.9% |
| Brazilians | 85.4 /100 | #130 | Excellent 10.9% |
| Macedonians | 84.2 /100 | #131 | Excellent 11.0% |
| Immigrants | Fiji | 84.0 /100 | #132 | Excellent 11.0% |
| Ugandans | 83.9 /100 | #133 | Excellent 11.0% |
| Bhutanese | 83.4 /100 | #134 | Excellent 11.0% |
| Trinidadians and Tobagonians | 83.3 /100 | #135 | Excellent 11.0% |
| Immigrants | Costa Rica | 82.8 /100 | #136 | Excellent 11.0% |
| Immigrants | Europe | 82.0 /100 | #137 | Excellent 11.0% |
| Nigerians | 81.9 /100 | #138 | Excellent 11.0% |
| South Africans | 81.7 /100 | #139 | Excellent 11.0% |
Demographics Similar to Central American Indians by Male Disability
In terms of male disability, the demographic groups most similar to Central American Indians are Slovak (12.7%, a difference of 0.15%), Dutch (12.7%, a difference of 0.20%), Sioux (12.7%, a difference of 0.26%), Irish (12.7%, a difference of 0.31%), and German (12.7%, a difference of 0.32%).
| Demographics | Rating | Rank | Male Disability |
| Scandinavians | 0.1 /100 | #271 | Tragic 12.3% |
| Hmong | 0.0 /100 | #272 | Tragic 12.5% |
| Native Hawaiians | 0.0 /100 | #273 | Tragic 12.5% |
| Hopi | 0.0 /100 | #274 | Tragic 12.5% |
| Fijians | 0.0 /100 | #275 | Tragic 12.6% |
| Africans | 0.0 /100 | #276 | Tragic 12.6% |
| Finns | 0.0 /100 | #277 | Tragic 12.6% |
| Central American Indians | 0.0 /100 | #278 | Tragic 12.7% |
| Slovaks | 0.0 /100 | #279 | Tragic 12.7% |
| Dutch | 0.0 /100 | #280 | Tragic 12.7% |
| Sioux | 0.0 /100 | #281 | Tragic 12.7% |
| Irish | 0.0 /100 | #282 | Tragic 12.7% |
| Germans | 0.0 /100 | #283 | Tragic 12.7% |
| Spanish | 0.0 /100 | #284 | Tragic 12.7% |
| Welsh | 0.0 /100 | #285 | Tragic 12.7% |