Colombian vs French Male Disability
COMPARE
Colombian
French
Male Disability
Male Disability Comparison
Colombians
French
10.5%
MALE DISABILITY
99.2/ 100
METRIC RATING
68th/ 347
METRIC RANK
13.0%
MALE DISABILITY
0.0/ 100
METRIC RATING
301st/ 347
METRIC RANK
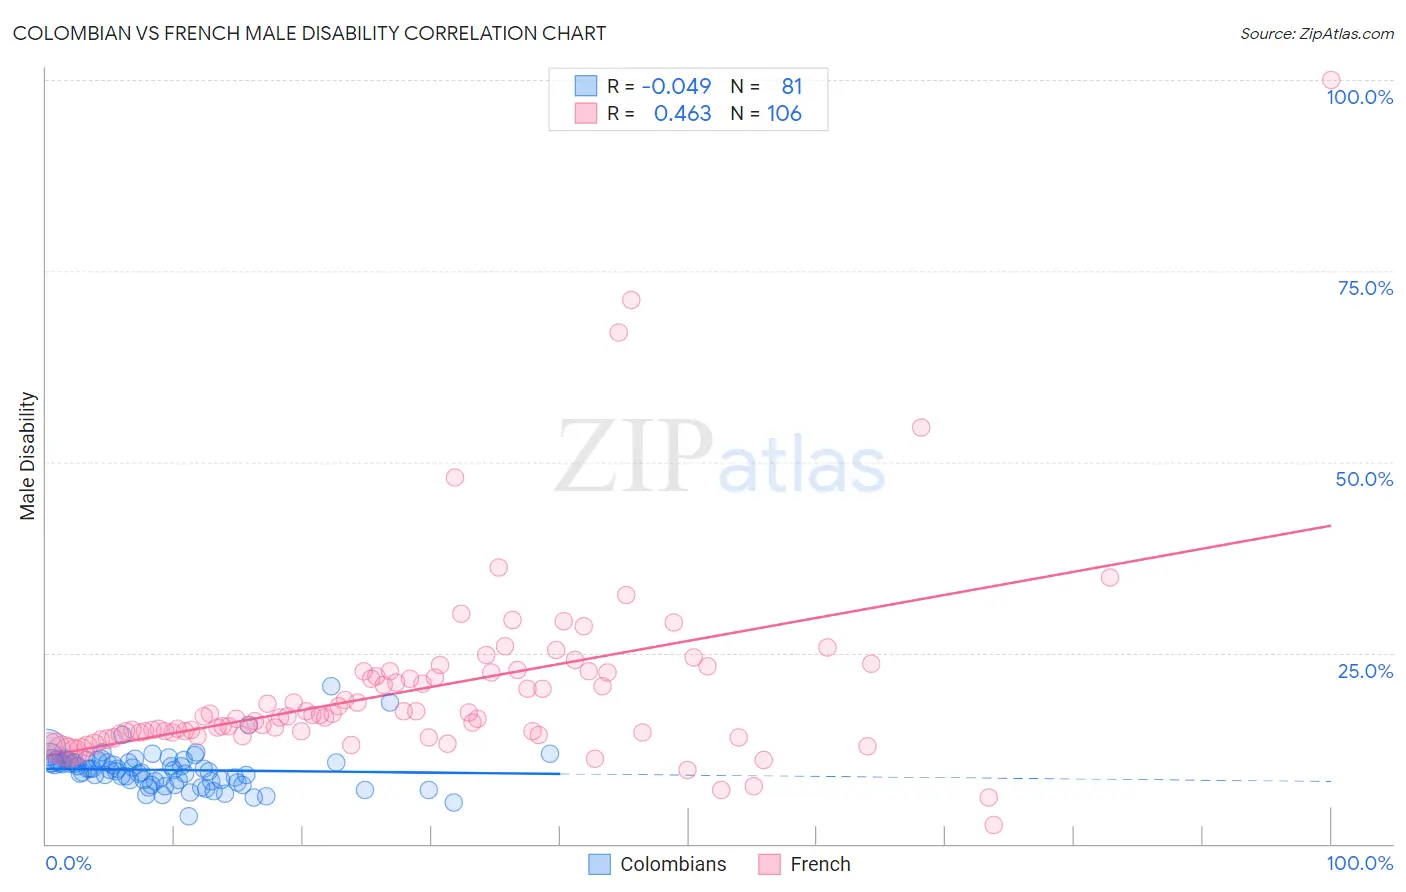
Colombian vs French Male Disability Correlation Chart
The statistical analysis conducted on geographies consisting of 419,578,648 people shows no correlation between the proportion of Colombians and percentage of males with a disability in the United States with a correlation coefficient (R) of -0.049 and weighted average of 10.5%. Similarly, the statistical analysis conducted on geographies consisting of 572,141,225 people shows a moderate positive correlation between the proportion of French and percentage of males with a disability in the United States with a correlation coefficient (R) of 0.463 and weighted average of 13.0%, a difference of 24.5%.
Male Disability Correlation Summary
| Measurement | Colombian | French |
| Minimum | 3.6% | 2.5% |
| Maximum | 20.7% | 100.0% |
| Range | 17.1% | 97.5% |
| Mean | 9.7% | 20.1% |
| Median | 9.7% | 16.6% |
| Interquartile 25% (IQ1) | 8.2% | 14.3% |
| Interquartile 75% (IQ3) | 10.9% | 22.4% |
| Interquartile Range (IQR) | 2.7% | 8.1% |
| Standard Deviation (Sample) | 2.5% | 12.8% |
| Standard Deviation (Population) | 2.5% | 12.8% |
Similar Demographics by Male Disability
Demographics Similar to Colombians by Male Disability
In terms of male disability, the demographic groups most similar to Colombians are Ecuadorian (10.5%, a difference of 0.0%), Guyanese (10.5%, a difference of 0.10%), Immigrants from Afghanistan (10.5%, a difference of 0.10%), Immigrants from Grenada (10.5%, a difference of 0.11%), and Jordanian (10.5%, a difference of 0.13%).
| Demographics | Rating | Rank | Male Disability |
| Immigrants | Northern Africa | 99.4 /100 | #61 | Exceptional 10.4% |
| Immigrants | Ecuador | 99.3 /100 | #62 | Exceptional 10.4% |
| Immigrants | Belarus | 99.3 /100 | #63 | Exceptional 10.4% |
| Jordanians | 99.3 /100 | #64 | Exceptional 10.5% |
| Immigrants | Grenada | 99.2 /100 | #65 | Exceptional 10.5% |
| Guyanese | 99.2 /100 | #66 | Exceptional 10.5% |
| Immigrants | Afghanistan | 99.2 /100 | #67 | Exceptional 10.5% |
| Colombians | 99.2 /100 | #68 | Exceptional 10.5% |
| Ecuadorians | 99.2 /100 | #69 | Exceptional 10.5% |
| Immigrants | Bulgaria | 99.1 /100 | #70 | Exceptional 10.5% |
| Immigrants | Cameroon | 99.0 /100 | #71 | Exceptional 10.5% |
| Immigrants | Serbia | 99.0 /100 | #72 | Exceptional 10.5% |
| Immigrants | Lithuania | 98.9 /100 | #73 | Exceptional 10.5% |
| Immigrants | Lebanon | 98.8 /100 | #74 | Exceptional 10.5% |
| Sierra Leoneans | 98.7 /100 | #75 | Exceptional 10.5% |
Demographics Similar to French by Male Disability
In terms of male disability, the demographic groups most similar to French are Cheyenne (13.0%, a difference of 0.040%), Celtic (13.0%, a difference of 0.13%), Pennsylvania German (13.0%, a difference of 0.48%), Crow (13.1%, a difference of 0.58%), and Inupiat (13.0%, a difference of 0.69%).
| Demographics | Rating | Rank | Male Disability |
| Marshallese | 0.0 /100 | #294 | Tragic 12.9% |
| Immigrants | Micronesia | 0.0 /100 | #295 | Tragic 12.9% |
| Immigrants | Nonimmigrants | 0.0 /100 | #296 | Tragic 12.9% |
| Inupiat | 0.0 /100 | #297 | Tragic 13.0% |
| Pennsylvania Germans | 0.0 /100 | #298 | Tragic 13.0% |
| Celtics | 0.0 /100 | #299 | Tragic 13.0% |
| Cheyenne | 0.0 /100 | #300 | Tragic 13.0% |
| French | 0.0 /100 | #301 | Tragic 13.0% |
| Crow | 0.0 /100 | #302 | Tragic 13.1% |
| Scotch-Irish | 0.0 /100 | #303 | Tragic 13.2% |
| Blacks/African Americans | 0.0 /100 | #304 | Tragic 13.2% |
| French Canadians | 0.0 /100 | #305 | Tragic 13.3% |
| Spanish Americans | 0.0 /100 | #306 | Tragic 13.3% |
| Arapaho | 0.0 /100 | #307 | Tragic 13.3% |
| French American Indians | 0.0 /100 | #308 | Tragic 13.4% |