Immigrants from Eastern Asia vs French Male Disability
COMPARE
Immigrants from Eastern Asia
French
Male Disability
Male Disability Comparison
Immigrants from Eastern Asia
French
9.6%
MALE DISABILITY
100.0/ 100
METRIC RATING
11th/ 347
METRIC RANK
13.0%
MALE DISABILITY
0.0/ 100
METRIC RATING
301st/ 347
METRIC RANK
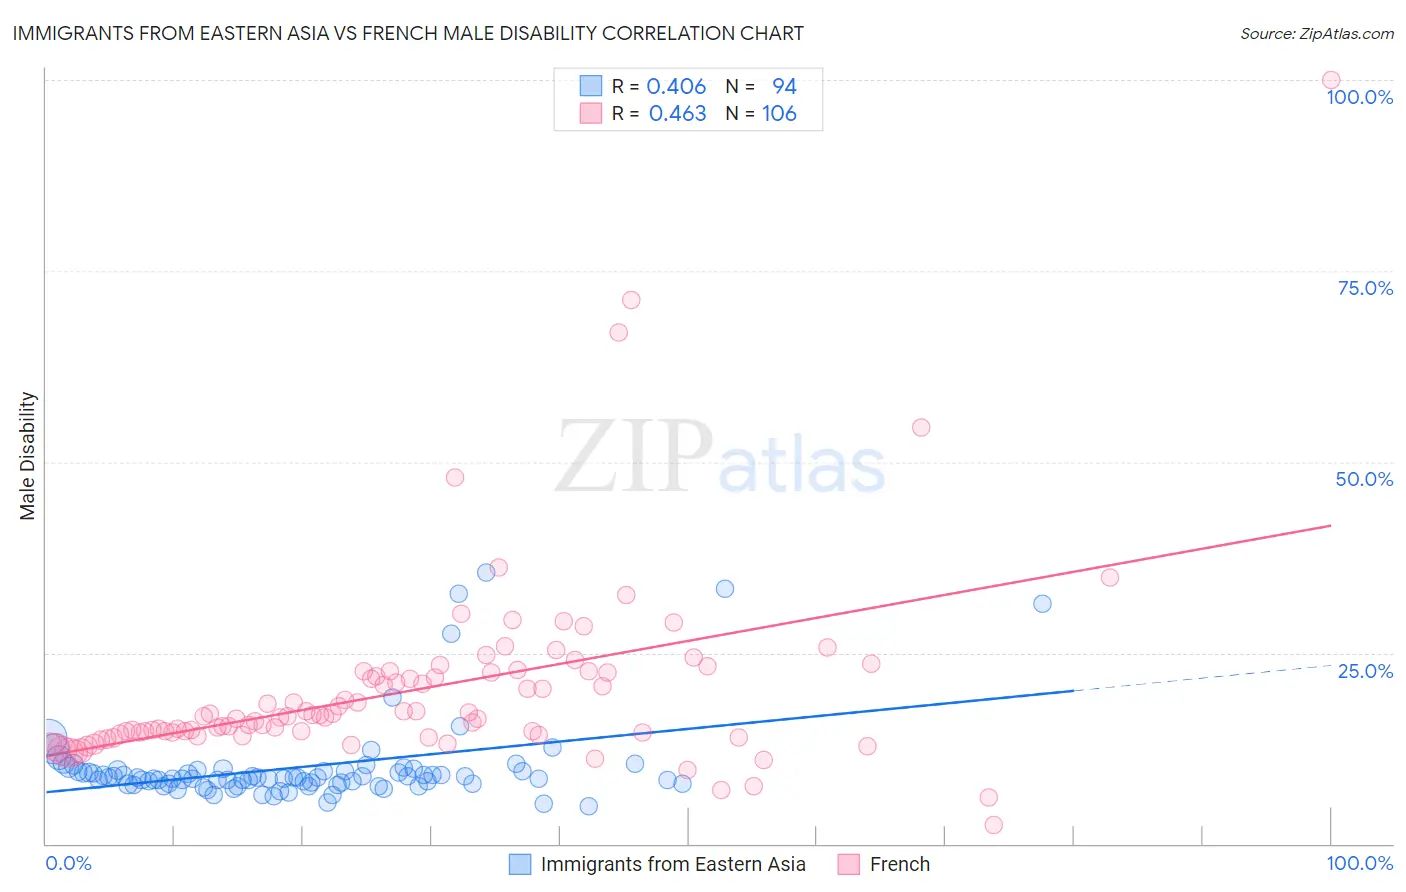
Immigrants from Eastern Asia vs French Male Disability Correlation Chart
The statistical analysis conducted on geographies consisting of 499,820,999 people shows a moderate positive correlation between the proportion of Immigrants from Eastern Asia and percentage of males with a disability in the United States with a correlation coefficient (R) of 0.406 and weighted average of 9.6%. Similarly, the statistical analysis conducted on geographies consisting of 572,141,225 people shows a moderate positive correlation between the proportion of French and percentage of males with a disability in the United States with a correlation coefficient (R) of 0.463 and weighted average of 13.0%, a difference of 35.6%.
Male Disability Correlation Summary
| Measurement | Immigrants from Eastern Asia | French |
| Minimum | 4.9% | 2.5% |
| Maximum | 35.5% | 100.0% |
| Range | 30.6% | 97.5% |
| Mean | 10.0% | 20.1% |
| Median | 8.7% | 16.6% |
| Interquartile 25% (IQ1) | 7.9% | 14.3% |
| Interquartile 75% (IQ3) | 9.5% | 22.4% |
| Interquartile Range (IQR) | 1.6% | 8.1% |
| Standard Deviation (Sample) | 5.6% | 12.8% |
| Standard Deviation (Population) | 5.6% | 12.8% |
Similar Demographics by Male Disability
Demographics Similar to Immigrants from Eastern Asia by Male Disability
In terms of male disability, the demographic groups most similar to Immigrants from Eastern Asia are Bolivian (9.6%, a difference of 0.24%), Iranian (9.7%, a difference of 0.46%), Immigrants from Israel (9.6%, a difference of 0.55%), Immigrants from Iran (9.7%, a difference of 0.56%), and Immigrants from Singapore (9.5%, a difference of 0.98%).
| Demographics | Rating | Rank | Male Disability |
| Thais | 100.0 /100 | #4 | Exceptional 9.2% |
| Immigrants | Hong Kong | 100.0 /100 | #5 | Exceptional 9.4% |
| Immigrants | South Central Asia | 100.0 /100 | #6 | Exceptional 9.4% |
| Immigrants | Bolivia | 100.0 /100 | #7 | Exceptional 9.5% |
| Immigrants | China | 100.0 /100 | #8 | Exceptional 9.5% |
| Immigrants | Singapore | 100.0 /100 | #9 | Exceptional 9.5% |
| Immigrants | Israel | 100.0 /100 | #10 | Exceptional 9.6% |
| Immigrants | Eastern Asia | 100.0 /100 | #11 | Exceptional 9.6% |
| Bolivians | 100.0 /100 | #12 | Exceptional 9.6% |
| Iranians | 100.0 /100 | #13 | Exceptional 9.7% |
| Immigrants | Iran | 100.0 /100 | #14 | Exceptional 9.7% |
| Indians (Asian) | 100.0 /100 | #15 | Exceptional 9.7% |
| Okinawans | 100.0 /100 | #16 | Exceptional 9.8% |
| Immigrants | Korea | 100.0 /100 | #17 | Exceptional 9.8% |
| Immigrants | Pakistan | 100.0 /100 | #18 | Exceptional 9.8% |
Demographics Similar to French by Male Disability
In terms of male disability, the demographic groups most similar to French are Cheyenne (13.0%, a difference of 0.040%), Celtic (13.0%, a difference of 0.13%), Pennsylvania German (13.0%, a difference of 0.48%), Crow (13.1%, a difference of 0.58%), and Inupiat (13.0%, a difference of 0.69%).
| Demographics | Rating | Rank | Male Disability |
| Marshallese | 0.0 /100 | #294 | Tragic 12.9% |
| Immigrants | Micronesia | 0.0 /100 | #295 | Tragic 12.9% |
| Immigrants | Nonimmigrants | 0.0 /100 | #296 | Tragic 12.9% |
| Inupiat | 0.0 /100 | #297 | Tragic 13.0% |
| Pennsylvania Germans | 0.0 /100 | #298 | Tragic 13.0% |
| Celtics | 0.0 /100 | #299 | Tragic 13.0% |
| Cheyenne | 0.0 /100 | #300 | Tragic 13.0% |
| French | 0.0 /100 | #301 | Tragic 13.0% |
| Crow | 0.0 /100 | #302 | Tragic 13.1% |
| Scotch-Irish | 0.0 /100 | #303 | Tragic 13.2% |
| Blacks/African Americans | 0.0 /100 | #304 | Tragic 13.2% |
| French Canadians | 0.0 /100 | #305 | Tragic 13.3% |
| Spanish Americans | 0.0 /100 | #306 | Tragic 13.3% |
| Arapaho | 0.0 /100 | #307 | Tragic 13.3% |
| French American Indians | 0.0 /100 | #308 | Tragic 13.4% |