Immigrants from Cameroon vs Chilean Disability Age 5 to 17
COMPARE
Immigrants from Cameroon
Chilean
Disability Age 5 to 17
Disability Age 5 to 17 Comparison
Immigrants from Cameroon
Chileans
5.8%
DISABILITY AGE 5 TO 17
8.3/ 100
METRIC RATING
213th/ 347
METRIC RANK
5.4%
DISABILITY AGE 5 TO 17
95.8/ 100
METRIC RATING
122nd/ 347
METRIC RANK
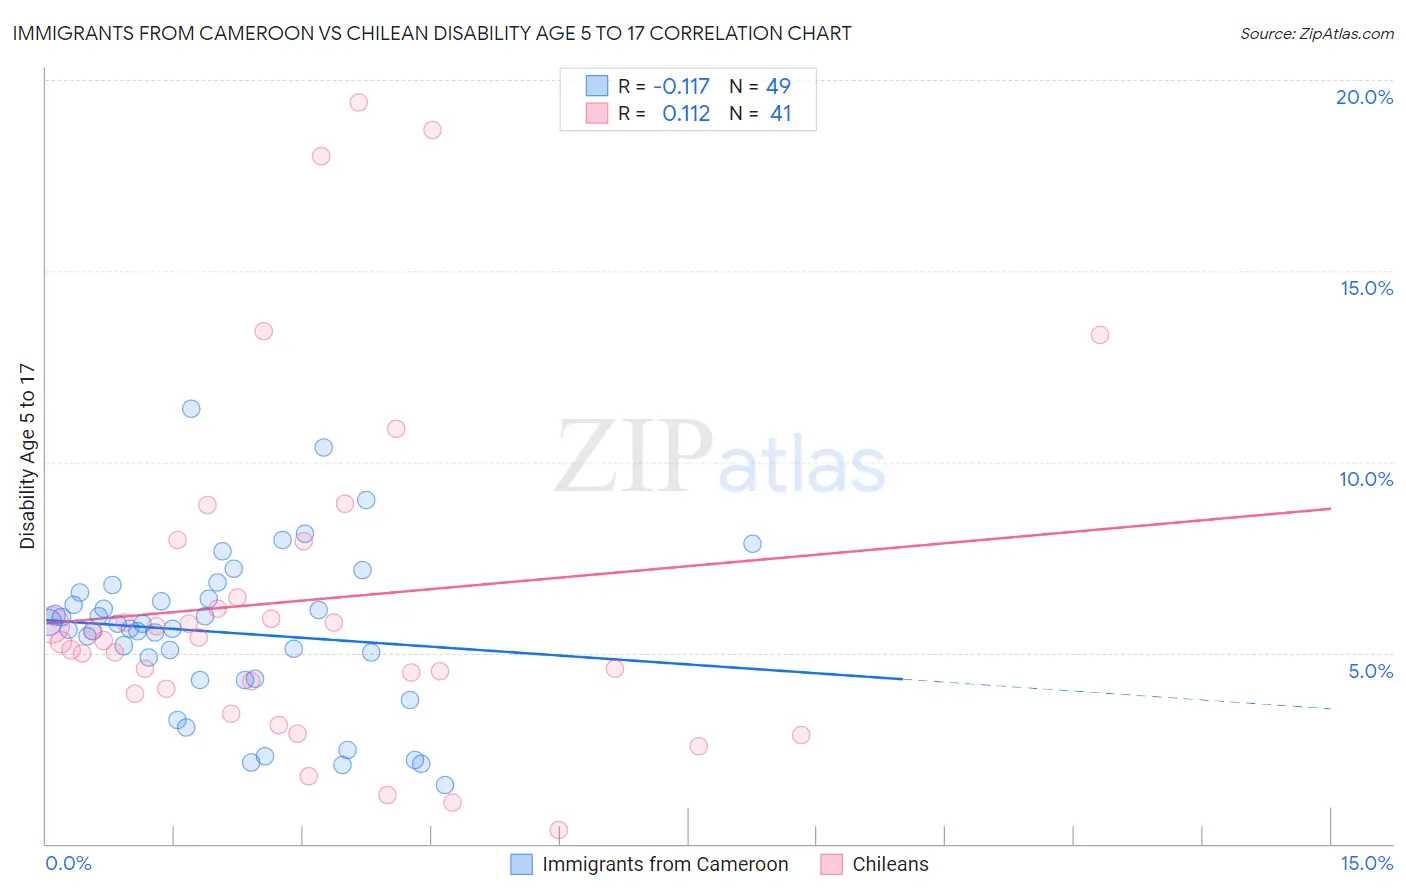
Immigrants from Cameroon vs Chilean Disability Age 5 to 17 Correlation Chart
The statistical analysis conducted on geographies consisting of 130,401,709 people shows a poor negative correlation between the proportion of Immigrants from Cameroon and percentage of population with a disability between the ages 5 and 17 in the United States with a correlation coefficient (R) of -0.117 and weighted average of 5.8%. Similarly, the statistical analysis conducted on geographies consisting of 255,519,515 people shows a poor positive correlation between the proportion of Chileans and percentage of population with a disability between the ages 5 and 17 in the United States with a correlation coefficient (R) of 0.112 and weighted average of 5.4%, a difference of 7.1%.
Disability Age 5 to 17 Correlation Summary
| Measurement | Immigrants from Cameroon | Chilean |
| Minimum | 1.5% | 0.37% |
| Maximum | 11.4% | 19.4% |
| Range | 9.9% | 19.1% |
| Mean | 5.5% | 6.4% |
| Median | 5.6% | 5.3% |
| Interquartile 25% (IQ1) | 4.3% | 4.0% |
| Interquartile 75% (IQ3) | 6.5% | 7.2% |
| Interquartile Range (IQR) | 2.2% | 3.2% |
| Standard Deviation (Sample) | 2.1% | 4.5% |
| Standard Deviation (Population) | 2.1% | 4.4% |
Similar Demographics by Disability Age 5 to 17
Demographics Similar to Immigrants from Cameroon by Disability Age 5 to 17
In terms of disability age 5 to 17, the demographic groups most similar to Immigrants from Cameroon are Immigrants from Morocco (5.8%, a difference of 0.0%), Swedish (5.8%, a difference of 0.040%), Immigrants from Panama (5.8%, a difference of 0.050%), Yugoslavian (5.8%, a difference of 0.12%), and Nigerian (5.8%, a difference of 0.13%).
| Demographics | Rating | Rank | Disability Age 5 to 17 |
| Immigrants | Africa | 10.8 /100 | #206 | Poor 5.7% |
| Moroccans | 10.4 /100 | #207 | Poor 5.7% |
| Kenyans | 10.0 /100 | #208 | Poor 5.8% |
| Immigrants | Uganda | 9.7 /100 | #209 | Tragic 5.8% |
| Immigrants | Haiti | 9.5 /100 | #210 | Tragic 5.8% |
| Yugoslavians | 9.1 /100 | #211 | Tragic 5.8% |
| Immigrants | Panama | 8.7 /100 | #212 | Tragic 5.8% |
| Immigrants | Cameroon | 8.3 /100 | #213 | Tragic 5.8% |
| Immigrants | Morocco | 8.3 /100 | #214 | Tragic 5.8% |
| Swedes | 8.1 /100 | #215 | Tragic 5.8% |
| Nigerians | 7.5 /100 | #216 | Tragic 5.8% |
| Czechs | 7.4 /100 | #217 | Tragic 5.8% |
| Immigrants | Sierra Leone | 7.1 /100 | #218 | Tragic 5.8% |
| Sierra Leoneans | 7.0 /100 | #219 | Tragic 5.8% |
| Belgians | 6.9 /100 | #220 | Tragic 5.8% |
Demographics Similar to Chileans by Disability Age 5 to 17
In terms of disability age 5 to 17, the demographic groups most similar to Chileans are Maltese (5.4%, a difference of 0.060%), Immigrants from Ethiopia (5.4%, a difference of 0.10%), Crow (5.4%, a difference of 0.23%), Immigrants from Chile (5.4%, a difference of 0.24%), and New Zealander (5.4%, a difference of 0.25%).
| Demographics | Rating | Rank | Disability Age 5 to 17 |
| Cubans | 97.8 /100 | #115 | Exceptional 5.3% |
| Cypriots | 97.7 /100 | #116 | Exceptional 5.3% |
| Immigrants | Afghanistan | 97.4 /100 | #117 | Exceptional 5.3% |
| South Americans | 97.1 /100 | #118 | Exceptional 5.4% |
| Immigrants | South America | 97.1 /100 | #119 | Exceptional 5.4% |
| Immigrants | Immigrants | 97.0 /100 | #120 | Exceptional 5.4% |
| Maltese | 96.0 /100 | #121 | Exceptional 5.4% |
| Chileans | 95.8 /100 | #122 | Exceptional 5.4% |
| Immigrants | Ethiopia | 95.5 /100 | #123 | Exceptional 5.4% |
| Crow | 95.0 /100 | #124 | Exceptional 5.4% |
| Immigrants | Chile | 95.0 /100 | #125 | Exceptional 5.4% |
| New Zealanders | 95.0 /100 | #126 | Exceptional 5.4% |
| Latvians | 95.0 /100 | #127 | Exceptional 5.4% |
| Immigrants | Venezuela | 94.5 /100 | #128 | Exceptional 5.4% |
| Romanians | 94.1 /100 | #129 | Exceptional 5.4% |