Immigrants from Europe vs Immigrants from Argentina Disability
COMPARE
Immigrants from Europe
Immigrants from Argentina
Disability
Disability Comparison
Immigrants from Europe
Immigrants from Argentina
11.4%
DISABILITY
90.4/ 100
METRIC RATING
128th/ 347
METRIC RANK
10.6%
DISABILITY
100.0/ 100
METRIC RATING
29th/ 347
METRIC RANK
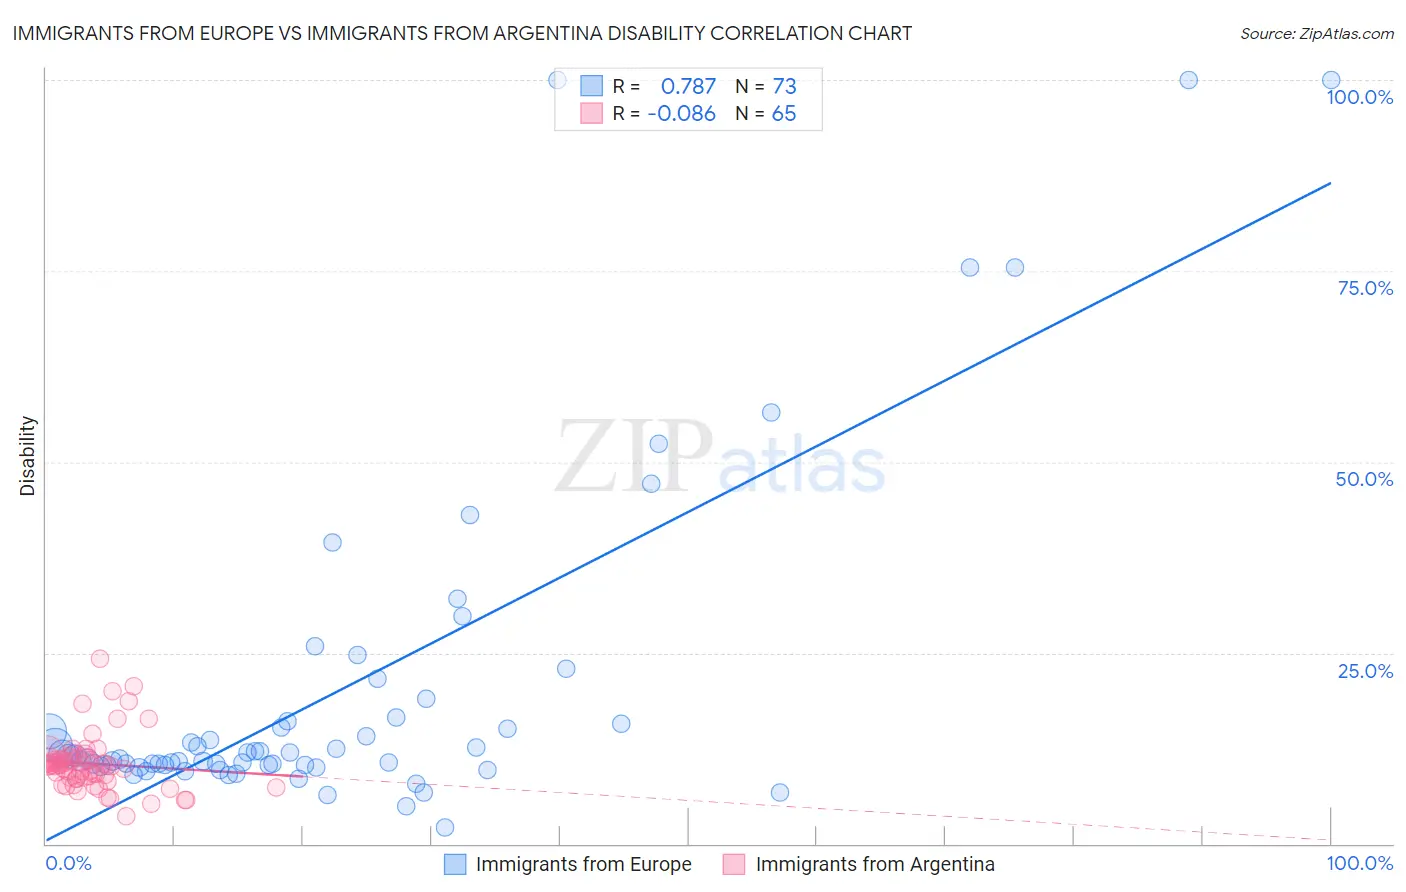
Immigrants from Europe vs Immigrants from Argentina Disability Correlation Chart
The statistical analysis conducted on geographies consisting of 547,337,167 people shows a strong positive correlation between the proportion of Immigrants from Europe and percentage of population with a disability in the United States with a correlation coefficient (R) of 0.787 and weighted average of 11.4%. Similarly, the statistical analysis conducted on geographies consisting of 264,433,054 people shows a slight negative correlation between the proportion of Immigrants from Argentina and percentage of population with a disability in the United States with a correlation coefficient (R) of -0.086 and weighted average of 10.6%, a difference of 7.5%.
Disability Correlation Summary
| Measurement | Immigrants from Europe | Immigrants from Argentina |
| Minimum | 2.1% | 3.5% |
| Maximum | 100.0% | 24.2% |
| Range | 97.9% | 20.7% |
| Mean | 20.2% | 10.5% |
| Median | 11.4% | 10.3% |
| Interquartile 25% (IQ1) | 10.2% | 8.5% |
| Interquartile 75% (IQ3) | 16.3% | 11.3% |
| Interquartile Range (IQR) | 6.0% | 2.7% |
| Standard Deviation (Sample) | 22.0% | 3.7% |
| Standard Deviation (Population) | 21.8% | 3.7% |
Similar Demographics by Disability
Demographics Similar to Immigrants from Europe by Disability
In terms of disability, the demographic groups most similar to Immigrants from Europe are Immigrants from Italy (11.4%, a difference of 0.0%), Macedonian (11.4%, a difference of 0.010%), Immigrants from Latvia (11.4%, a difference of 0.070%), Latvian (11.4%, a difference of 0.070%), and Immigrants from Croatia (11.4%, a difference of 0.080%).
| Demographics | Rating | Rank | Disability |
| Immigrants | Costa Rica | 93.4 /100 | #121 | Exceptional 11.4% |
| Brazilians | 93.3 /100 | #122 | Exceptional 11.4% |
| South Africans | 92.3 /100 | #123 | Exceptional 11.4% |
| South American Indians | 92.2 /100 | #124 | Exceptional 11.4% |
| Costa Ricans | 91.9 /100 | #125 | Exceptional 11.4% |
| Immigrants | Latvia | 90.9 /100 | #126 | Exceptional 11.4% |
| Immigrants | Italy | 90.4 /100 | #127 | Exceptional 11.4% |
| Immigrants | Europe | 90.4 /100 | #128 | Exceptional 11.4% |
| Macedonians | 90.3 /100 | #129 | Exceptional 11.4% |
| Latvians | 89.8 /100 | #130 | Excellent 11.4% |
| Immigrants | Croatia | 89.8 /100 | #131 | Excellent 11.4% |
| Immigrants | Africa | 89.3 /100 | #132 | Excellent 11.4% |
| Arabs | 89.1 /100 | #133 | Excellent 11.4% |
| Immigrants | Guyana | 88.3 /100 | #134 | Excellent 11.4% |
| Ugandans | 87.9 /100 | #135 | Excellent 11.4% |
Demographics Similar to Immigrants from Argentina by Disability
In terms of disability, the demographic groups most similar to Immigrants from Argentina are Egyptian (10.6%, a difference of 0.13%), Immigrants from Turkey (10.6%, a difference of 0.15%), Immigrants from Egypt (10.6%, a difference of 0.23%), Cypriot (10.6%, a difference of 0.26%), and Argentinean (10.6%, a difference of 0.27%).
| Demographics | Rating | Rank | Disability |
| Immigrants | Sri Lanka | 100.0 /100 | #22 | Exceptional 10.5% |
| Immigrants | Asia | 100.0 /100 | #23 | Exceptional 10.5% |
| Venezuelans | 100.0 /100 | #24 | Exceptional 10.5% |
| Immigrants | Malaysia | 100.0 /100 | #25 | Exceptional 10.6% |
| Argentineans | 100.0 /100 | #26 | Exceptional 10.6% |
| Cypriots | 100.0 /100 | #27 | Exceptional 10.6% |
| Egyptians | 100.0 /100 | #28 | Exceptional 10.6% |
| Immigrants | Argentina | 100.0 /100 | #29 | Exceptional 10.6% |
| Immigrants | Turkey | 100.0 /100 | #30 | Exceptional 10.6% |
| Immigrants | Egypt | 100.0 /100 | #31 | Exceptional 10.6% |
| Paraguayans | 100.0 /100 | #32 | Exceptional 10.6% |
| Immigrants | Kuwait | 100.0 /100 | #33 | Exceptional 10.7% |
| Immigrants | Ethiopia | 100.0 /100 | #34 | Exceptional 10.7% |
| Immigrants | Indonesia | 100.0 /100 | #35 | Exceptional 10.7% |
| Ethiopians | 100.0 /100 | #36 | Exceptional 10.7% |