Immigrants from Europe vs Immigrants from Peru Disability
COMPARE
Immigrants from Europe
Immigrants from Peru
Disability
Disability Comparison
Immigrants from Europe
Immigrants from Peru
11.4%
DISABILITY
90.4/ 100
METRIC RATING
128th/ 347
METRIC RANK
10.8%
DISABILITY
99.9/ 100
METRIC RATING
45th/ 347
METRIC RANK
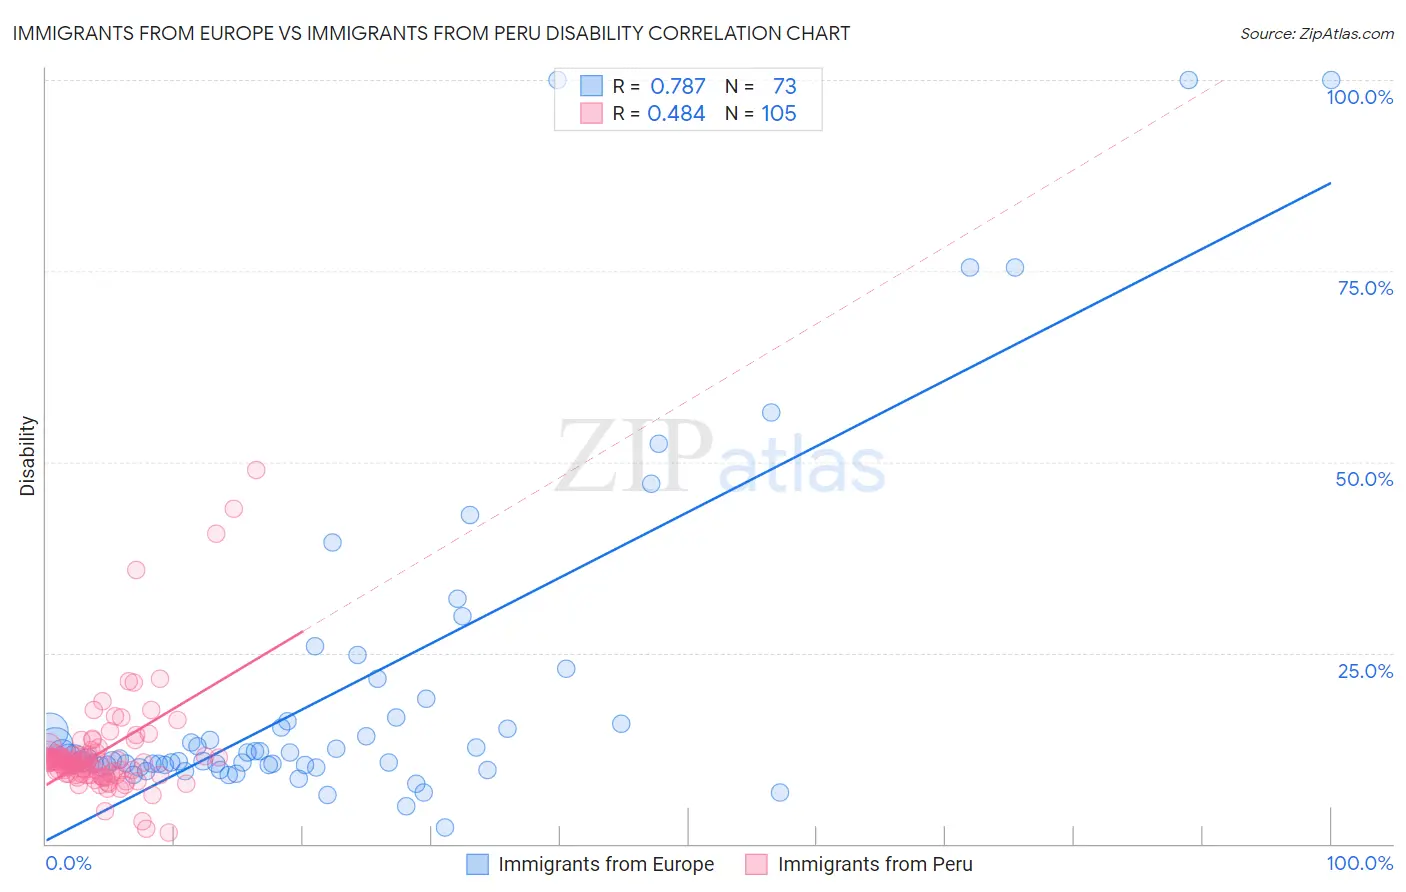
Immigrants from Europe vs Immigrants from Peru Disability Correlation Chart
The statistical analysis conducted on geographies consisting of 547,337,167 people shows a strong positive correlation between the proportion of Immigrants from Europe and percentage of population with a disability in the United States with a correlation coefficient (R) of 0.787 and weighted average of 11.4%. Similarly, the statistical analysis conducted on geographies consisting of 328,839,266 people shows a moderate positive correlation between the proportion of Immigrants from Peru and percentage of population with a disability in the United States with a correlation coefficient (R) of 0.484 and weighted average of 10.8%, a difference of 5.4%.
Disability Correlation Summary
| Measurement | Immigrants from Europe | Immigrants from Peru |
| Minimum | 2.1% | 1.4% |
| Maximum | 100.0% | 49.0% |
| Range | 97.9% | 47.6% |
| Mean | 20.2% | 12.0% |
| Median | 11.4% | 10.7% |
| Interquartile 25% (IQ1) | 10.2% | 9.1% |
| Interquartile 75% (IQ3) | 16.3% | 11.7% |
| Interquartile Range (IQR) | 6.0% | 2.6% |
| Standard Deviation (Sample) | 22.0% | 7.0% |
| Standard Deviation (Population) | 21.8% | 6.9% |
Similar Demographics by Disability
Demographics Similar to Immigrants from Europe by Disability
In terms of disability, the demographic groups most similar to Immigrants from Europe are Immigrants from Italy (11.4%, a difference of 0.0%), Macedonian (11.4%, a difference of 0.010%), Immigrants from Latvia (11.4%, a difference of 0.070%), Latvian (11.4%, a difference of 0.070%), and Immigrants from Croatia (11.4%, a difference of 0.080%).
| Demographics | Rating | Rank | Disability |
| Immigrants | Costa Rica | 93.4 /100 | #121 | Exceptional 11.4% |
| Brazilians | 93.3 /100 | #122 | Exceptional 11.4% |
| South Africans | 92.3 /100 | #123 | Exceptional 11.4% |
| South American Indians | 92.2 /100 | #124 | Exceptional 11.4% |
| Costa Ricans | 91.9 /100 | #125 | Exceptional 11.4% |
| Immigrants | Latvia | 90.9 /100 | #126 | Exceptional 11.4% |
| Immigrants | Italy | 90.4 /100 | #127 | Exceptional 11.4% |
| Immigrants | Europe | 90.4 /100 | #128 | Exceptional 11.4% |
| Macedonians | 90.3 /100 | #129 | Exceptional 11.4% |
| Latvians | 89.8 /100 | #130 | Excellent 11.4% |
| Immigrants | Croatia | 89.8 /100 | #131 | Excellent 11.4% |
| Immigrants | Africa | 89.3 /100 | #132 | Excellent 11.4% |
| Arabs | 89.1 /100 | #133 | Excellent 11.4% |
| Immigrants | Guyana | 88.3 /100 | #134 | Excellent 11.4% |
| Ugandans | 87.9 /100 | #135 | Excellent 11.4% |
Demographics Similar to Immigrants from Peru by Disability
In terms of disability, the demographic groups most similar to Immigrants from Peru are Tongan (10.8%, a difference of 0.010%), Taiwanese (10.8%, a difference of 0.020%), Soviet Union (10.9%, a difference of 0.21%), Vietnamese (10.9%, a difference of 0.27%), and Immigrants from Saudi Arabia (10.9%, a difference of 0.27%).
| Demographics | Rating | Rank | Disability |
| Afghans | 99.9 /100 | #38 | Exceptional 10.8% |
| Cambodians | 99.9 /100 | #39 | Exceptional 10.8% |
| Mongolians | 99.9 /100 | #40 | Exceptional 10.8% |
| Immigrants | Australia | 99.9 /100 | #41 | Exceptional 10.8% |
| Immigrants | Nepal | 99.9 /100 | #42 | Exceptional 10.8% |
| Israelis | 99.9 /100 | #43 | Exceptional 10.8% |
| Immigrants | Japan | 99.9 /100 | #44 | Exceptional 10.8% |
| Immigrants | Peru | 99.9 /100 | #45 | Exceptional 10.8% |
| Tongans | 99.9 /100 | #46 | Exceptional 10.8% |
| Taiwanese | 99.9 /100 | #47 | Exceptional 10.8% |
| Soviet Union | 99.9 /100 | #48 | Exceptional 10.9% |
| Vietnamese | 99.9 /100 | #49 | Exceptional 10.9% |
| Immigrants | Saudi Arabia | 99.9 /100 | #50 | Exceptional 10.9% |
| Peruvians | 99.8 /100 | #51 | Exceptional 10.9% |
| South Americans | 99.8 /100 | #52 | Exceptional 10.9% |