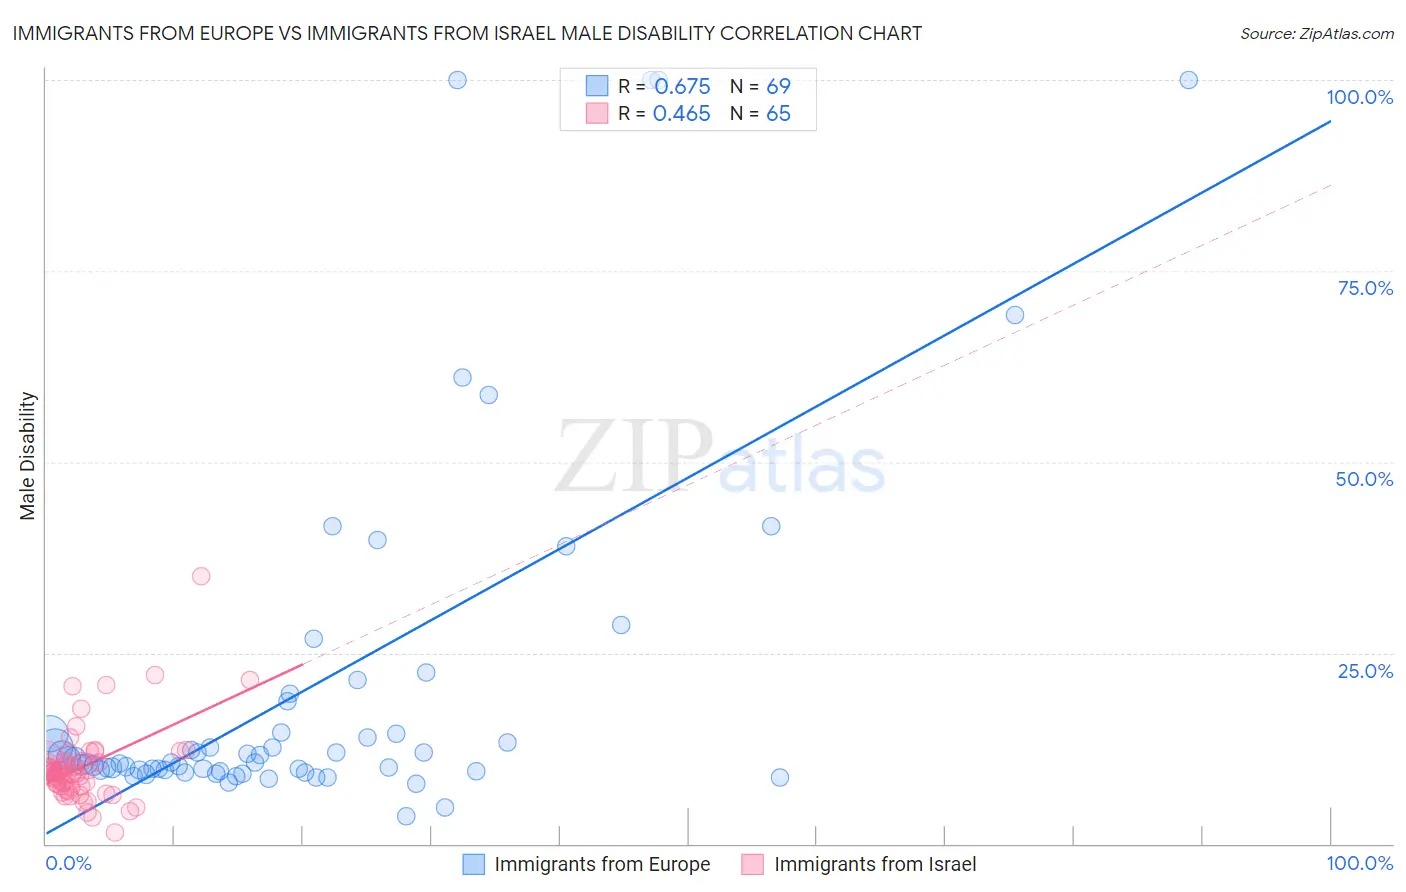
Immigrants from Europe vs Immigrants from Israel Male Disability
COMPARE
Immigrants from Europe
Immigrants from Israel
Male Disability
Male Disability Comparison
Immigrants from Europe
Immigrants from Israel
11.0%
MALE DISABILITY
82.0/ 100
METRIC RATING
137th/ 347
METRIC RANK
9.6%
MALE DISABILITY
100.0/ 100
METRIC RATING
10th/ 347
METRIC RANK
Immigrants from Europe vs Immigrants from Israel Male Disability Correlation Chart
The statistical analysis conducted on geographies consisting of 547,240,570 people shows a significant positive correlation between the proportion of Immigrants from Europe and percentage of males with a disability in the United States with a correlation coefficient (R) of 0.675 and weighted average of 11.0%. Similarly, the statistical analysis conducted on geographies consisting of 210,033,213 people shows a moderate positive correlation between the proportion of Immigrants from Israel and percentage of males with a disability in the United States with a correlation coefficient (R) of 0.465 and weighted average of 9.6%, a difference of 14.8%.
Male Disability Correlation Summary
| Measurement | Immigrants from Europe | Immigrants from Israel |
| Minimum | 3.6% | 1.5% |
| Maximum | 100.0% | 35.0% |
| Range | 96.4% | 33.5% |
| Mean | 20.7% | 10.1% |
| Median | 10.7% | 9.3% |
| Interquartile 25% (IQ1) | 9.6% | 7.4% |
| Interquartile 75% (IQ3) | 16.6% | 10.8% |
| Interquartile Range (IQR) | 7.0% | 3.4% |
| Standard Deviation (Sample) | 23.7% | 5.1% |
| Standard Deviation (Population) | 23.5% | 5.1% |
Similar Demographics by Male Disability
Demographics Similar to Immigrants from Europe by Male Disability
In terms of male disability, the demographic groups most similar to Immigrants from Europe are Nigerian (11.0%, a difference of 0.010%), South African (11.0%, a difference of 0.030%), Immigrants from Italy (11.0%, a difference of 0.040%), Arab (11.0%, a difference of 0.050%), and Immigrants from Sudan (11.0%, a difference of 0.050%).
| Demographics | Rating | Rank | Male Disability |
| Brazilians | 85.4 /100 | #130 | Excellent 10.9% |
| Macedonians | 84.2 /100 | #131 | Excellent 11.0% |
| Immigrants | Fiji | 84.0 /100 | #132 | Excellent 11.0% |
| Ugandans | 83.9 /100 | #133 | Excellent 11.0% |
| Bhutanese | 83.4 /100 | #134 | Excellent 11.0% |
| Trinidadians and Tobagonians | 83.3 /100 | #135 | Excellent 11.0% |
| Immigrants | Costa Rica | 82.8 /100 | #136 | Excellent 11.0% |
| Immigrants | Europe | 82.0 /100 | #137 | Excellent 11.0% |
| Nigerians | 81.9 /100 | #138 | Excellent 11.0% |
| South Africans | 81.7 /100 | #139 | Excellent 11.0% |
| Immigrants | Italy | 81.5 /100 | #140 | Excellent 11.0% |
| Arabs | 81.5 /100 | #141 | Excellent 11.0% |
| Immigrants | Sudan | 81.5 /100 | #142 | Excellent 11.0% |
| Moroccans | 80.7 /100 | #143 | Excellent 11.0% |
| Kenyans | 78.1 /100 | #144 | Good 11.0% |
Demographics Similar to Immigrants from Israel by Male Disability
In terms of male disability, the demographic groups most similar to Immigrants from Israel are Immigrants from Singapore (9.5%, a difference of 0.43%), Immigrants from China (9.5%, a difference of 0.51%), Immigrants from Eastern Asia (9.6%, a difference of 0.55%), Bolivian (9.6%, a difference of 0.79%), and Iranian (9.7%, a difference of 1.0%).
| Demographics | Rating | Rank | Male Disability |
| Filipinos | 100.0 /100 | #3 | Exceptional 9.1% |
| Thais | 100.0 /100 | #4 | Exceptional 9.2% |
| Immigrants | Hong Kong | 100.0 /100 | #5 | Exceptional 9.4% |
| Immigrants | South Central Asia | 100.0 /100 | #6 | Exceptional 9.4% |
| Immigrants | Bolivia | 100.0 /100 | #7 | Exceptional 9.5% |
| Immigrants | China | 100.0 /100 | #8 | Exceptional 9.5% |
| Immigrants | Singapore | 100.0 /100 | #9 | Exceptional 9.5% |
| Immigrants | Israel | 100.0 /100 | #10 | Exceptional 9.6% |
| Immigrants | Eastern Asia | 100.0 /100 | #11 | Exceptional 9.6% |
| Bolivians | 100.0 /100 | #12 | Exceptional 9.6% |
| Iranians | 100.0 /100 | #13 | Exceptional 9.7% |
| Immigrants | Iran | 100.0 /100 | #14 | Exceptional 9.7% |
| Indians (Asian) | 100.0 /100 | #15 | Exceptional 9.7% |
| Okinawans | 100.0 /100 | #16 | Exceptional 9.8% |
| Immigrants | Korea | 100.0 /100 | #17 | Exceptional 9.8% |