Immigrants from Europe vs Mexican American Indian Male Disability
COMPARE
Immigrants from Europe
Mexican American Indian
Male Disability
Male Disability Comparison
Immigrants from Europe
Mexican American Indians
11.0%
MALE DISABILITY
82.0/ 100
METRIC RATING
137th/ 347
METRIC RANK
11.6%
MALE DISABILITY
7.8/ 100
METRIC RATING
213th/ 347
METRIC RANK
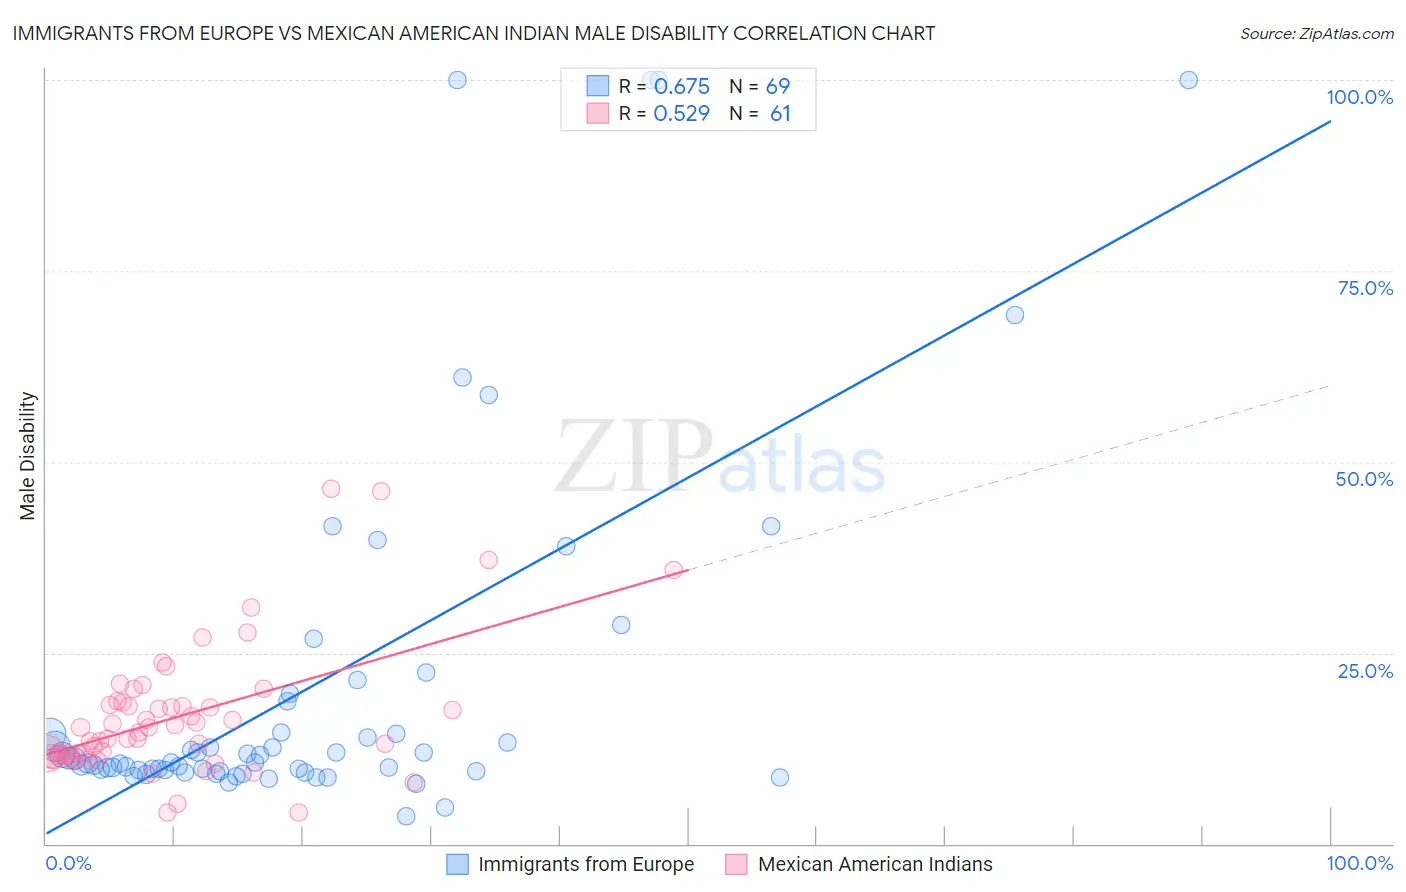
Immigrants from Europe vs Mexican American Indian Male Disability Correlation Chart
The statistical analysis conducted on geographies consisting of 547,240,570 people shows a significant positive correlation between the proportion of Immigrants from Europe and percentage of males with a disability in the United States with a correlation coefficient (R) of 0.675 and weighted average of 11.0%. Similarly, the statistical analysis conducted on geographies consisting of 317,563,584 people shows a substantial positive correlation between the proportion of Mexican American Indians and percentage of males with a disability in the United States with a correlation coefficient (R) of 0.529 and weighted average of 11.6%, a difference of 5.6%.
Male Disability Correlation Summary
| Measurement | Immigrants from Europe | Mexican American Indian |
| Minimum | 3.6% | 4.1% |
| Maximum | 100.0% | 46.4% |
| Range | 96.4% | 42.3% |
| Mean | 20.7% | 16.6% |
| Median | 10.7% | 14.5% |
| Interquartile 25% (IQ1) | 9.6% | 11.5% |
| Interquartile 75% (IQ3) | 16.6% | 18.4% |
| Interquartile Range (IQR) | 7.0% | 6.8% |
| Standard Deviation (Sample) | 23.7% | 8.5% |
| Standard Deviation (Population) | 23.5% | 8.4% |
Similar Demographics by Male Disability
Demographics Similar to Immigrants from Europe by Male Disability
In terms of male disability, the demographic groups most similar to Immigrants from Europe are Nigerian (11.0%, a difference of 0.010%), South African (11.0%, a difference of 0.030%), Immigrants from Italy (11.0%, a difference of 0.040%), Arab (11.0%, a difference of 0.050%), and Immigrants from Sudan (11.0%, a difference of 0.050%).
| Demographics | Rating | Rank | Male Disability |
| Brazilians | 85.4 /100 | #130 | Excellent 10.9% |
| Macedonians | 84.2 /100 | #131 | Excellent 11.0% |
| Immigrants | Fiji | 84.0 /100 | #132 | Excellent 11.0% |
| Ugandans | 83.9 /100 | #133 | Excellent 11.0% |
| Bhutanese | 83.4 /100 | #134 | Excellent 11.0% |
| Trinidadians and Tobagonians | 83.3 /100 | #135 | Excellent 11.0% |
| Immigrants | Costa Rica | 82.8 /100 | #136 | Excellent 11.0% |
| Immigrants | Europe | 82.0 /100 | #137 | Excellent 11.0% |
| Nigerians | 81.9 /100 | #138 | Excellent 11.0% |
| South Africans | 81.7 /100 | #139 | Excellent 11.0% |
| Immigrants | Italy | 81.5 /100 | #140 | Excellent 11.0% |
| Arabs | 81.5 /100 | #141 | Excellent 11.0% |
| Immigrants | Sudan | 81.5 /100 | #142 | Excellent 11.0% |
| Moroccans | 80.7 /100 | #143 | Excellent 11.0% |
| Kenyans | 78.1 /100 | #144 | Good 11.0% |
Demographics Similar to Mexican American Indians by Male Disability
In terms of male disability, the demographic groups most similar to Mexican American Indians are Immigrants from Scotland (11.6%, a difference of 0.080%), Immigrants from Thailand (11.6%, a difference of 0.10%), Lithuanian (11.6%, a difference of 0.24%), Ute (11.6%, a difference of 0.28%), and Spanish American Indian (11.6%, a difference of 0.37%).
| Demographics | Rating | Rank | Male Disability |
| Ukrainians | 10.6 /100 | #206 | Poor 11.5% |
| Immigrants | Somalia | 10.4 /100 | #207 | Poor 11.5% |
| Icelanders | 10.1 /100 | #208 | Poor 11.6% |
| Spanish American Indians | 10.1 /100 | #209 | Poor 11.6% |
| Ute | 9.4 /100 | #210 | Tragic 11.6% |
| Immigrants | Thailand | 8.4 /100 | #211 | Tragic 11.6% |
| Immigrants | Scotland | 8.2 /100 | #212 | Tragic 11.6% |
| Mexican American Indians | 7.8 /100 | #213 | Tragic 11.6% |
| Lithuanians | 6.6 /100 | #214 | Tragic 11.6% |
| Indonesians | 5.9 /100 | #215 | Tragic 11.6% |
| Immigrants | Dominican Republic | 4.9 /100 | #216 | Tragic 11.7% |
| Immigrants | Dominica | 4.6 /100 | #217 | Tragic 11.7% |
| Immigrants | England | 4.0 /100 | #218 | Tragic 11.7% |
| Panamanians | 3.8 /100 | #219 | Tragic 11.7% |
| Immigrants | Western Europe | 3.8 /100 | #220 | Tragic 11.7% |