Immigrants from Eritrea vs Immigrants from Poland Disability
COMPARE
Immigrants from Eritrea
Immigrants from Poland
Disability
Disability Comparison
Immigrants from Eritrea
Immigrants from Poland
11.0%
DISABILITY
99.7/ 100
METRIC RATING
63rd/ 347
METRIC RANK
11.1%
DISABILITY
99.1/ 100
METRIC RATING
81st/ 347
METRIC RANK
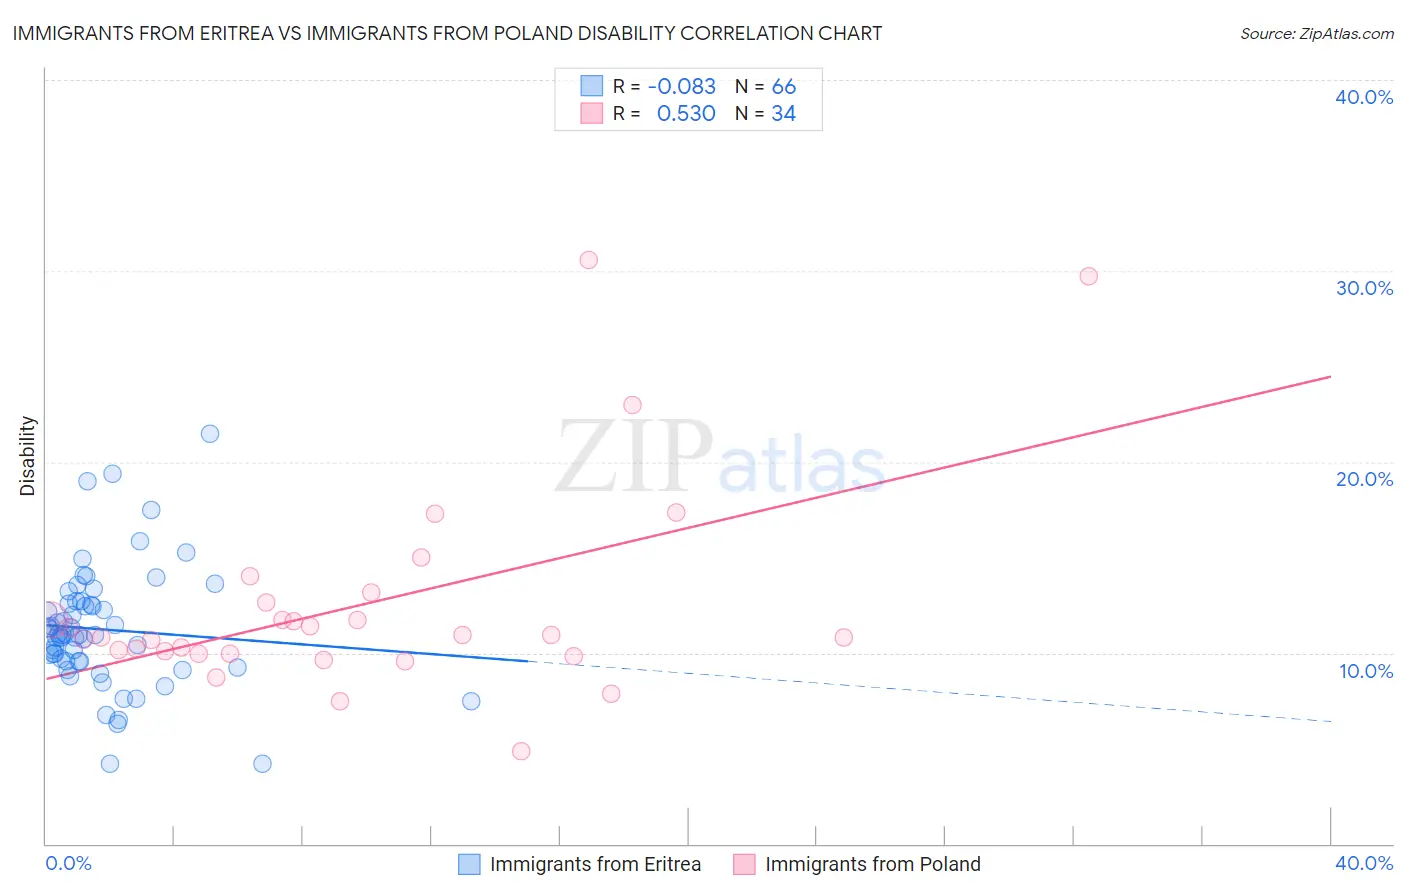
Immigrants from Eritrea vs Immigrants from Poland Disability Correlation Chart
The statistical analysis conducted on geographies consisting of 104,852,788 people shows a slight negative correlation between the proportion of Immigrants from Eritrea and percentage of population with a disability in the United States with a correlation coefficient (R) of -0.083 and weighted average of 11.0%. Similarly, the statistical analysis conducted on geographies consisting of 304,838,062 people shows a substantial positive correlation between the proportion of Immigrants from Poland and percentage of population with a disability in the United States with a correlation coefficient (R) of 0.530 and weighted average of 11.1%, a difference of 1.3%.
Disability Correlation Summary
| Measurement | Immigrants from Eritrea | Immigrants from Poland |
| Minimum | 4.2% | 4.8% |
| Maximum | 21.4% | 30.6% |
| Range | 17.2% | 25.7% |
| Mean | 11.2% | 12.5% |
| Median | 10.9% | 10.9% |
| Interquartile 25% (IQ1) | 9.6% | 10.0% |
| Interquartile 75% (IQ3) | 12.6% | 12.6% |
| Interquartile Range (IQR) | 3.0% | 2.7% |
| Standard Deviation (Sample) | 3.2% | 5.5% |
| Standard Deviation (Population) | 3.1% | 5.4% |
Demographics Similar to Immigrants from Eritrea and Immigrants from Poland by Disability
In terms of disability, the demographic groups most similar to Immigrants from Eritrea are Immigrants from Northern Africa (10.9%, a difference of 0.020%), Immigrants from Sweden (11.0%, a difference of 0.18%), Bulgarian (11.0%, a difference of 0.20%), Laotian (11.0%, a difference of 0.21%), and Colombian (11.0%, a difference of 0.30%). Similarly, the demographic groups most similar to Immigrants from Poland are Chilean (11.1%, a difference of 0.050%), Immigrants from Ireland (11.1%, a difference of 0.25%), Immigrants from Jordan (11.1%, a difference of 0.30%), Immigrants from Cameroon (11.1%, a difference of 0.33%), and Sierra Leonean (11.0%, a difference of 0.37%).
| Demographics | Rating | Rank | Disability |
| Immigrants | Northern Africa | 99.7 /100 | #62 | Exceptional 10.9% |
| Immigrants | Eritrea | 99.7 /100 | #63 | Exceptional 11.0% |
| Immigrants | Sweden | 99.6 /100 | #64 | Exceptional 11.0% |
| Bulgarians | 99.6 /100 | #65 | Exceptional 11.0% |
| Laotians | 99.6 /100 | #66 | Exceptional 11.0% |
| Colombians | 99.6 /100 | #67 | Exceptional 11.0% |
| Immigrants | Afghanistan | 99.6 /100 | #68 | Exceptional 11.0% |
| Sri Lankans | 99.5 /100 | #69 | Exceptional 11.0% |
| Immigrants | France | 99.4 /100 | #70 | Exceptional 11.0% |
| Immigrants | Lebanon | 99.4 /100 | #71 | Exceptional 11.0% |
| Immigrants | Chile | 99.4 /100 | #72 | Exceptional 11.0% |
| Immigrants | Bangladesh | 99.4 /100 | #73 | Exceptional 11.0% |
| Immigrants | Serbia | 99.4 /100 | #74 | Exceptional 11.0% |
| Immigrants | Vietnam | 99.4 /100 | #75 | Exceptional 11.0% |
| Sierra Leoneans | 99.3 /100 | #76 | Exceptional 11.0% |
| Immigrants | Belgium | 99.3 /100 | #77 | Exceptional 11.0% |
| Immigrants | Cameroon | 99.3 /100 | #78 | Exceptional 11.1% |
| Immigrants | Jordan | 99.3 /100 | #79 | Exceptional 11.1% |
| Immigrants | Ireland | 99.3 /100 | #80 | Exceptional 11.1% |
| Immigrants | Poland | 99.1 /100 | #81 | Exceptional 11.1% |
| Chileans | 99.1 /100 | #82 | Exceptional 11.1% |