Immigrants from Eritrea vs Ottawa Disability
COMPARE
Immigrants from Eritrea
Ottawa
Disability
Disability Comparison
Immigrants from Eritrea
Ottawa
11.0%
DISABILITY
99.7/ 100
METRIC RATING
63rd/ 347
METRIC RANK
14.2%
DISABILITY
0.0/ 100
METRIC RATING
327th/ 347
METRIC RANK
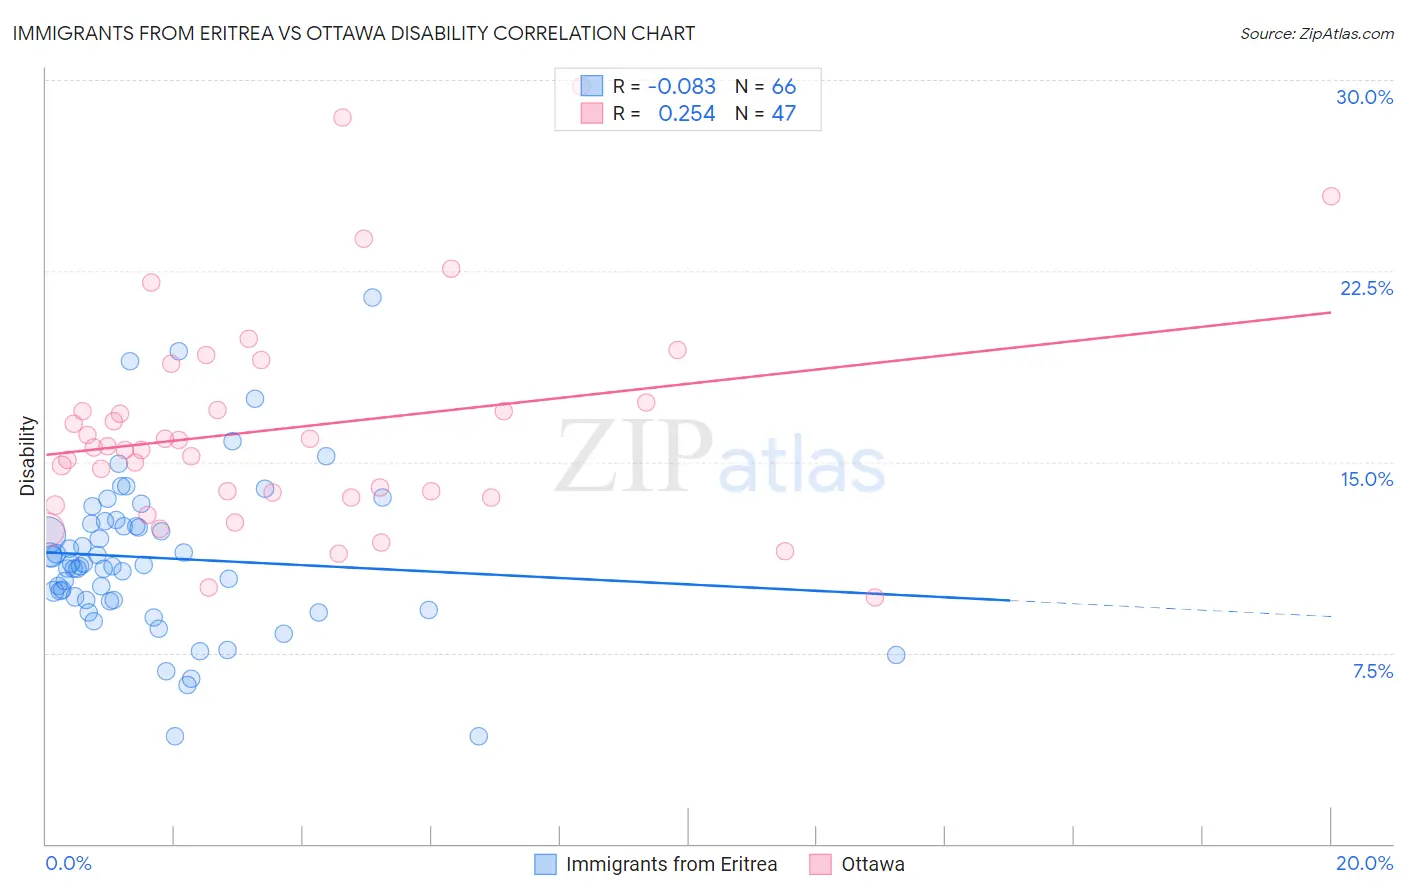
Immigrants from Eritrea vs Ottawa Disability Correlation Chart
The statistical analysis conducted on geographies consisting of 104,852,788 people shows a slight negative correlation between the proportion of Immigrants from Eritrea and percentage of population with a disability in the United States with a correlation coefficient (R) of -0.083 and weighted average of 11.0%. Similarly, the statistical analysis conducted on geographies consisting of 49,955,365 people shows a weak positive correlation between the proportion of Ottawa and percentage of population with a disability in the United States with a correlation coefficient (R) of 0.254 and weighted average of 14.2%, a difference of 29.3%.
Disability Correlation Summary
| Measurement | Immigrants from Eritrea | Ottawa |
| Minimum | 4.2% | 9.7% |
| Maximum | 21.4% | 29.8% |
| Range | 17.2% | 20.1% |
| Mean | 11.2% | 16.3% |
| Median | 10.9% | 15.6% |
| Interquartile 25% (IQ1) | 9.6% | 13.6% |
| Interquartile 75% (IQ3) | 12.6% | 17.3% |
| Interquartile Range (IQR) | 3.0% | 3.7% |
| Standard Deviation (Sample) | 3.2% | 4.3% |
| Standard Deviation (Population) | 3.1% | 4.3% |
Similar Demographics by Disability
Demographics Similar to Immigrants from Eritrea by Disability
In terms of disability, the demographic groups most similar to Immigrants from Eritrea are Immigrants from Northern Africa (10.9%, a difference of 0.020%), Immigrants from Bulgaria (10.9%, a difference of 0.060%), Zimbabwean (10.9%, a difference of 0.11%), Immigrants from Sweden (11.0%, a difference of 0.18%), and Bulgarian (11.0%, a difference of 0.20%).
| Demographics | Rating | Rank | Disability |
| Immigrants | Lithuania | 99.8 /100 | #56 | Exceptional 10.9% |
| Salvadorans | 99.8 /100 | #57 | Exceptional 10.9% |
| Immigrants | South America | 99.8 /100 | #58 | Exceptional 10.9% |
| Immigrants | Colombia | 99.7 /100 | #59 | Exceptional 10.9% |
| Zimbabweans | 99.7 /100 | #60 | Exceptional 10.9% |
| Immigrants | Bulgaria | 99.7 /100 | #61 | Exceptional 10.9% |
| Immigrants | Northern Africa | 99.7 /100 | #62 | Exceptional 10.9% |
| Immigrants | Eritrea | 99.7 /100 | #63 | Exceptional 11.0% |
| Immigrants | Sweden | 99.6 /100 | #64 | Exceptional 11.0% |
| Bulgarians | 99.6 /100 | #65 | Exceptional 11.0% |
| Laotians | 99.6 /100 | #66 | Exceptional 11.0% |
| Colombians | 99.6 /100 | #67 | Exceptional 11.0% |
| Immigrants | Afghanistan | 99.6 /100 | #68 | Exceptional 11.0% |
| Sri Lankans | 99.5 /100 | #69 | Exceptional 11.0% |
| Immigrants | France | 99.4 /100 | #70 | Exceptional 11.0% |
Demographics Similar to Ottawa by Disability
In terms of disability, the demographic groups most similar to Ottawa are Immigrants from the Azores (14.2%, a difference of 0.0%), Osage (14.2%, a difference of 0.020%), Native/Alaskan (14.2%, a difference of 0.060%), Chippewa (14.1%, a difference of 0.10%), and Potawatomi (14.2%, a difference of 0.12%).
| Demographics | Rating | Rank | Disability |
| Apache | 0.0 /100 | #320 | Tragic 13.9% |
| Paiute | 0.0 /100 | #321 | Tragic 13.9% |
| Americans | 0.0 /100 | #322 | Tragic 13.9% |
| Comanche | 0.0 /100 | #323 | Tragic 14.1% |
| Chippewa | 0.0 /100 | #324 | Tragic 14.1% |
| Natives/Alaskans | 0.0 /100 | #325 | Tragic 14.2% |
| Osage | 0.0 /100 | #326 | Tragic 14.2% |
| Ottawa | 0.0 /100 | #327 | Tragic 14.2% |
| Immigrants | Azores | 0.0 /100 | #328 | Tragic 14.2% |
| Potawatomi | 0.0 /100 | #329 | Tragic 14.2% |
| Navajo | 0.0 /100 | #330 | Tragic 14.3% |
| Alaskan Athabascans | 0.0 /100 | #331 | Tragic 14.4% |
| Pueblo | 0.0 /100 | #332 | Tragic 14.4% |
| Cajuns | 0.0 /100 | #333 | Tragic 14.6% |
| Yuman | 0.0 /100 | #334 | Tragic 14.6% |