Immigrants from Eritrea vs Chinese Median Female Earnings
COMPARE
Immigrants from Eritrea
Chinese
Median Female Earnings
Median Female Earnings Comparison
Immigrants from Eritrea
Chinese
$41,485
MEDIAN FEMALE EARNINGS
97.6/ 100
METRIC RATING
106th/ 347
METRIC RANK
$41,461
MEDIAN FEMALE EARNINGS
97.5/ 100
METRIC RATING
109th/ 347
METRIC RANK
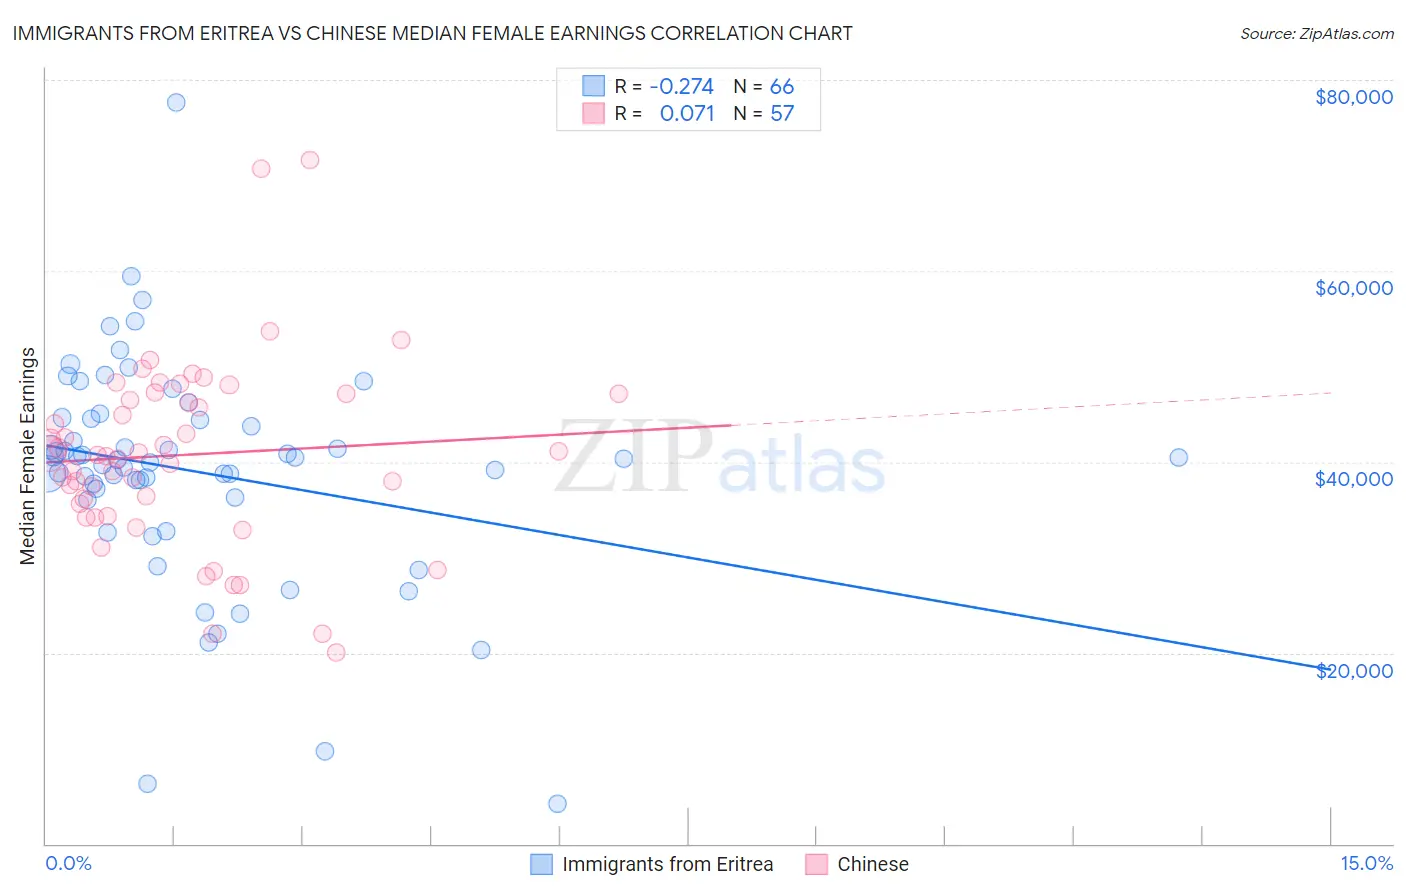
Immigrants from Eritrea vs Chinese Median Female Earnings Correlation Chart
The statistical analysis conducted on geographies consisting of 104,836,938 people shows a weak negative correlation between the proportion of Immigrants from Eritrea and median female earnings in the United States with a correlation coefficient (R) of -0.274 and weighted average of $41,485. Similarly, the statistical analysis conducted on geographies consisting of 64,808,152 people shows a slight positive correlation between the proportion of Chinese and median female earnings in the United States with a correlation coefficient (R) of 0.071 and weighted average of $41,461, a difference of 0.060%.
Median Female Earnings Correlation Summary
| Measurement | Immigrants from Eritrea | Chinese |
| Minimum | $4,132 | $20,043 |
| Maximum | $77,694 | $71,591 |
| Range | $73,562 | $51,548 |
| Mean | $38,981 | $40,727 |
| Median | $40,245 | $40,673 |
| Interquartile 25% (IQ1) | $36,285 | $34,915 |
| Interquartile 75% (IQ3) | $44,525 | $47,174 |
| Interquartile Range (IQR) | $8,239 | $12,258 |
| Standard Deviation (Sample) | $11,801 | $9,803 |
| Standard Deviation (Population) | $11,712 | $9,716 |
Demographics Similar to Immigrants from Eritrea and Chinese by Median Female Earnings
In terms of median female earnings, the demographic groups most similar to Immigrants from Eritrea are Palestinian ($41,484, a difference of 0.0%), Italian ($41,505, a difference of 0.050%), Jordanian ($41,464, a difference of 0.050%), Immigrants from Zimbabwe ($41,527, a difference of 0.10%), and Immigrants from Argentina ($41,554, a difference of 0.17%). Similarly, the demographic groups most similar to Chinese are Jordanian ($41,464, a difference of 0.010%), Palestinian ($41,484, a difference of 0.050%), Italian ($41,505, a difference of 0.10%), Immigrants from Zimbabwe ($41,527, a difference of 0.16%), and Immigrants from Western Asia ($41,375, a difference of 0.21%).
| Demographics | Rating | Rank | Median Female Earnings |
| Immigrants | Hungary | 98.8 /100 | #97 | Exceptional $41,820 |
| Immigrants | Scotland | 98.7 /100 | #98 | Exceptional $41,771 |
| Immigrants | Barbados | 98.4 /100 | #99 | Exceptional $41,685 |
| Romanians | 98.3 /100 | #100 | Exceptional $41,663 |
| Immigrants | Fiji | 98.3 /100 | #101 | Exceptional $41,656 |
| Immigrants | Poland | 98.2 /100 | #102 | Exceptional $41,630 |
| Immigrants | Argentina | 97.9 /100 | #103 | Exceptional $41,554 |
| Immigrants | Zimbabwe | 97.8 /100 | #104 | Exceptional $41,527 |
| Italians | 97.7 /100 | #105 | Exceptional $41,505 |
| Immigrants | Eritrea | 97.6 /100 | #106 | Exceptional $41,485 |
| Palestinians | 97.6 /100 | #107 | Exceptional $41,484 |
| Jordanians | 97.5 /100 | #108 | Exceptional $41,464 |
| Chinese | 97.5 /100 | #109 | Exceptional $41,461 |
| Immigrants | Western Asia | 97.0 /100 | #110 | Exceptional $41,375 |
| Immigrants | Canada | 97.0 /100 | #111 | Exceptional $41,373 |
| Immigrants | North America | 96.7 /100 | #112 | Exceptional $41,319 |
| Macedonians | 96.4 /100 | #113 | Exceptional $41,286 |
| Immigrants | England | 96.4 /100 | #114 | Exceptional $41,277 |
| Koreans | 96.4 /100 | #115 | Exceptional $41,276 |
| Immigrants | Brazil | 96.4 /100 | #116 | Exceptional $41,273 |
| Barbadians | 96.3 /100 | #117 | Exceptional $41,261 |