Immigrants from England vs Immigrants from South America Male Disability
COMPARE
Immigrants from England
Immigrants from South America
Male Disability
Male Disability Comparison
Immigrants from England
Immigrants from South America
11.7%
MALE DISABILITY
4.0/ 100
METRIC RATING
218th/ 347
METRIC RANK
10.4%
MALE DISABILITY
99.6/ 100
METRIC RATING
57th/ 347
METRIC RANK
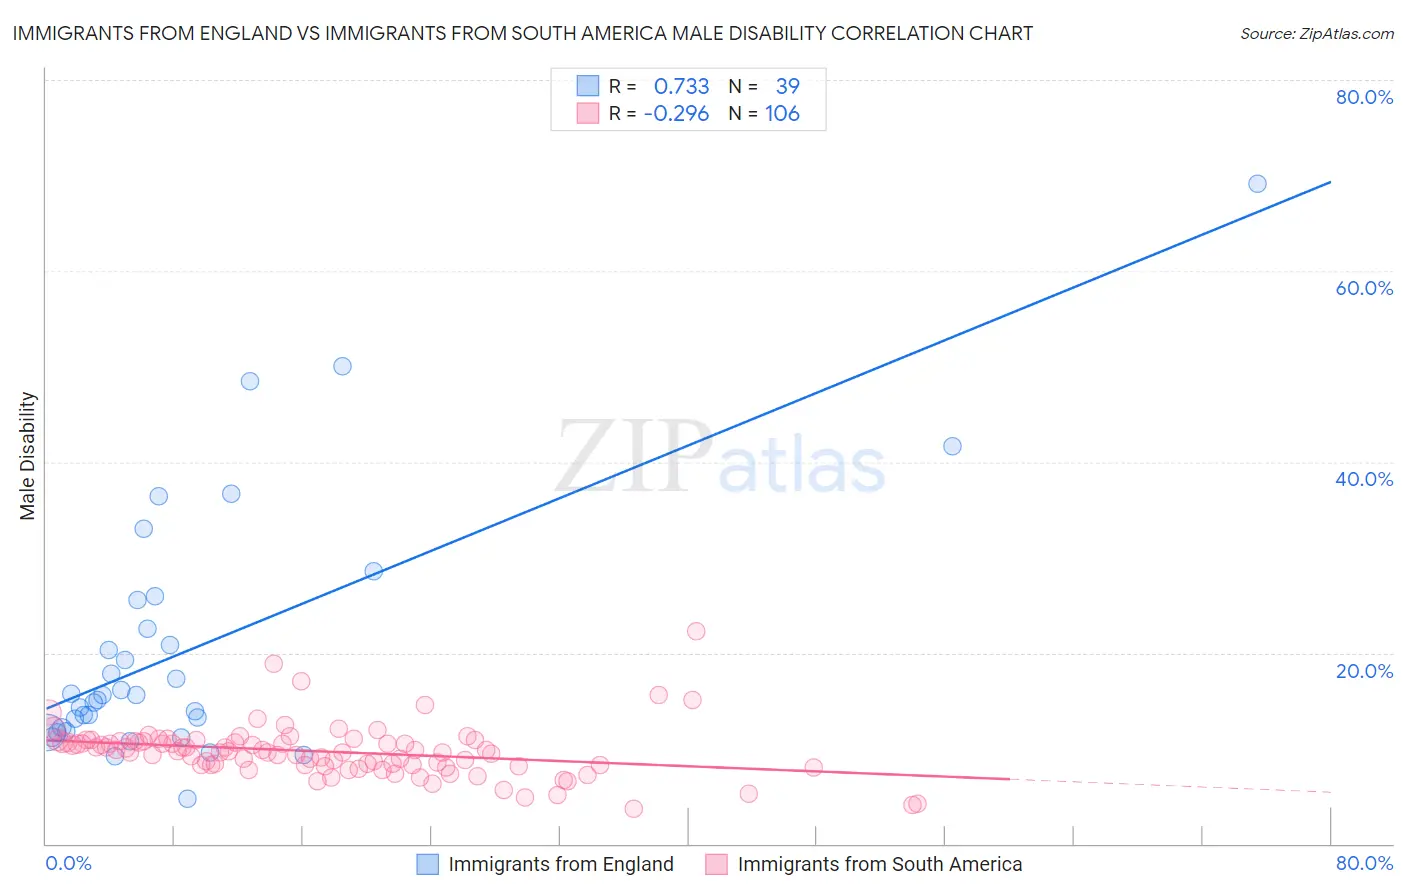
Immigrants from England vs Immigrants from South America Male Disability Correlation Chart
The statistical analysis conducted on geographies consisting of 391,879,882 people shows a strong positive correlation between the proportion of Immigrants from England and percentage of males with a disability in the United States with a correlation coefficient (R) of 0.733 and weighted average of 11.7%. Similarly, the statistical analysis conducted on geographies consisting of 486,285,750 people shows a weak negative correlation between the proportion of Immigrants from South America and percentage of males with a disability in the United States with a correlation coefficient (R) of -0.296 and weighted average of 10.4%, a difference of 12.9%.
Male Disability Correlation Summary
| Measurement | Immigrants from England | Immigrants from South America |
| Minimum | 4.7% | 3.7% |
| Maximum | 69.2% | 22.2% |
| Range | 64.4% | 18.6% |
| Mean | 20.5% | 9.7% |
| Median | 15.5% | 9.7% |
| Interquartile 25% (IQ1) | 11.8% | 8.3% |
| Interquartile 75% (IQ3) | 25.5% | 10.7% |
| Interquartile Range (IQR) | 13.6% | 2.5% |
| Standard Deviation (Sample) | 13.5% | 2.7% |
| Standard Deviation (Population) | 13.3% | 2.7% |
Similar Demographics by Male Disability
Demographics Similar to Immigrants from England by Male Disability
In terms of male disability, the demographic groups most similar to Immigrants from England are Panamanian (11.7%, a difference of 0.060%), Immigrants from Western Europe (11.7%, a difference of 0.070%), Immigrants from Congo (11.7%, a difference of 0.080%), Immigrants from Dominica (11.7%, a difference of 0.21%), and Alsatian (11.7%, a difference of 0.23%).
| Demographics | Rating | Rank | Male Disability |
| Immigrants | Thailand | 8.4 /100 | #211 | Tragic 11.6% |
| Immigrants | Scotland | 8.2 /100 | #212 | Tragic 11.6% |
| Mexican American Indians | 7.8 /100 | #213 | Tragic 11.6% |
| Lithuanians | 6.6 /100 | #214 | Tragic 11.6% |
| Indonesians | 5.9 /100 | #215 | Tragic 11.6% |
| Immigrants | Dominican Republic | 4.9 /100 | #216 | Tragic 11.7% |
| Immigrants | Dominica | 4.6 /100 | #217 | Tragic 11.7% |
| Immigrants | England | 4.0 /100 | #218 | Tragic 11.7% |
| Panamanians | 3.8 /100 | #219 | Tragic 11.7% |
| Immigrants | Western Europe | 3.8 /100 | #220 | Tragic 11.7% |
| Immigrants | Congo | 3.7 /100 | #221 | Tragic 11.7% |
| Alsatians | 3.3 /100 | #222 | Tragic 11.7% |
| Immigrants | Bahamas | 3.2 /100 | #223 | Tragic 11.7% |
| Japanese | 3.1 /100 | #224 | Tragic 11.7% |
| Liberians | 3.1 /100 | #225 | Tragic 11.8% |
Demographics Similar to Immigrants from South America by Male Disability
In terms of male disability, the demographic groups most similar to Immigrants from South America are Tongan (10.4%, a difference of 0.020%), Immigrants from Eritrea (10.4%, a difference of 0.060%), Immigrants from Japan (10.4%, a difference of 0.070%), Peruvian (10.4%, a difference of 0.080%), and Immigrants from Uzbekistan (10.4%, a difference of 0.12%).
| Demographics | Rating | Rank | Male Disability |
| South Americans | 99.6 /100 | #50 | Exceptional 10.3% |
| Salvadorans | 99.6 /100 | #51 | Exceptional 10.4% |
| Immigrants | Saudi Arabia | 99.6 /100 | #52 | Exceptional 10.4% |
| Immigrants | Uzbekistan | 99.6 /100 | #53 | Exceptional 10.4% |
| Peruvians | 99.6 /100 | #54 | Exceptional 10.4% |
| Immigrants | Eritrea | 99.6 /100 | #55 | Exceptional 10.4% |
| Tongans | 99.6 /100 | #56 | Exceptional 10.4% |
| Immigrants | South America | 99.6 /100 | #57 | Exceptional 10.4% |
| Immigrants | Japan | 99.5 /100 | #58 | Exceptional 10.4% |
| Immigrants | Australia | 99.5 /100 | #59 | Exceptional 10.4% |
| Immigrants | Colombia | 99.5 /100 | #60 | Exceptional 10.4% |
| Immigrants | Northern Africa | 99.4 /100 | #61 | Exceptional 10.4% |
| Immigrants | Ecuador | 99.3 /100 | #62 | Exceptional 10.4% |
| Immigrants | Belarus | 99.3 /100 | #63 | Exceptional 10.4% |
| Jordanians | 99.3 /100 | #64 | Exceptional 10.5% |