Immigrants from England vs Yugoslavian Male Disability
COMPARE
Immigrants from England
Yugoslavian
Male Disability
Male Disability Comparison
Immigrants from England
Yugoslavians
11.7%
MALE DISABILITY
4.0/ 100
METRIC RATING
218th/ 347
METRIC RANK
11.9%
MALE DISABILITY
1.2/ 100
METRIC RATING
238th/ 347
METRIC RANK
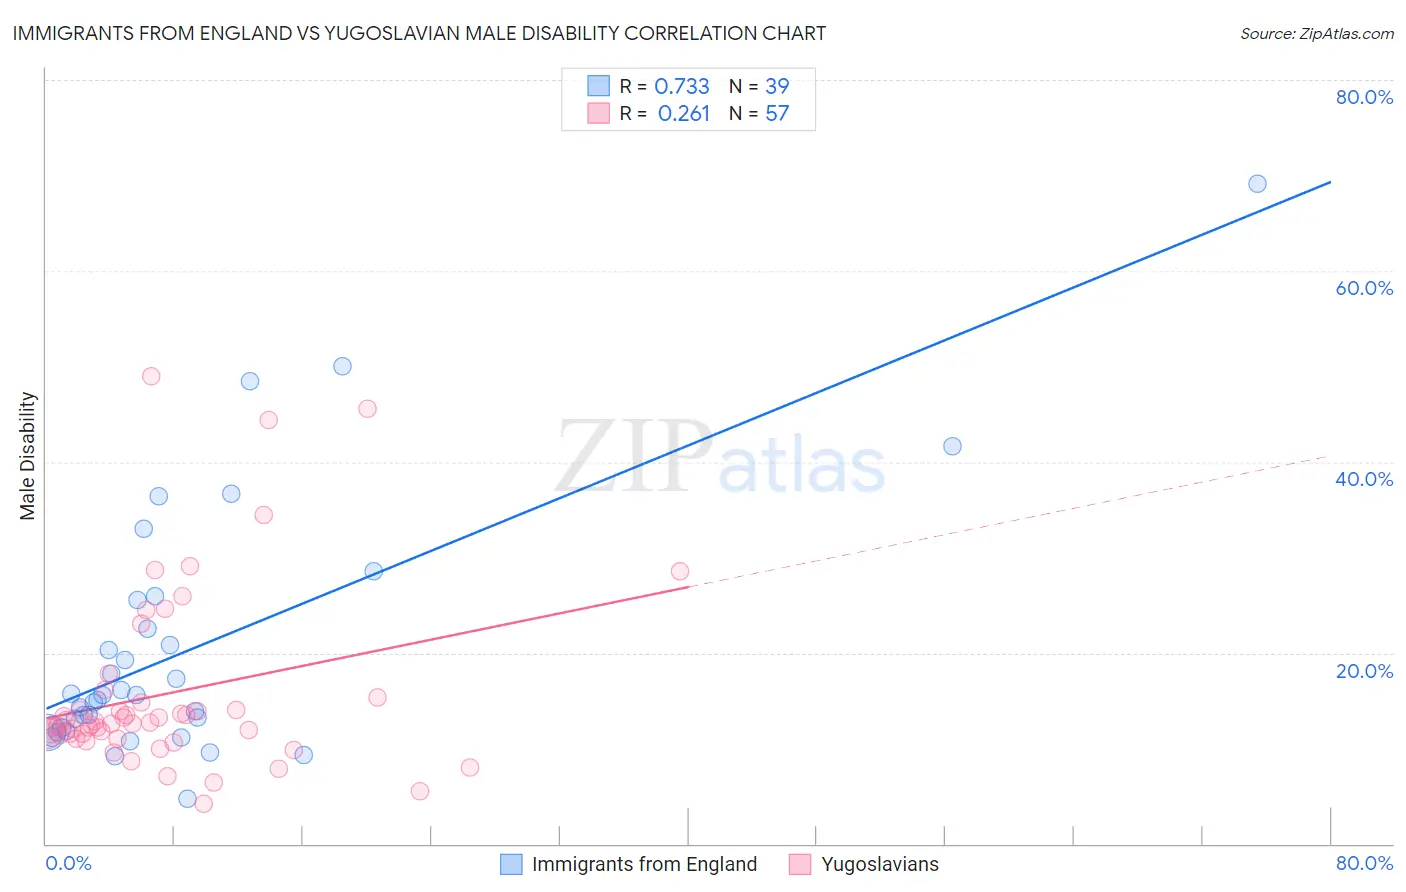
Immigrants from England vs Yugoslavian Male Disability Correlation Chart
The statistical analysis conducted on geographies consisting of 391,879,882 people shows a strong positive correlation between the proportion of Immigrants from England and percentage of males with a disability in the United States with a correlation coefficient (R) of 0.733 and weighted average of 11.7%. Similarly, the statistical analysis conducted on geographies consisting of 285,684,891 people shows a weak positive correlation between the proportion of Yugoslavians and percentage of males with a disability in the United States with a correlation coefficient (R) of 0.261 and weighted average of 11.9%, a difference of 1.6%.
Male Disability Correlation Summary
| Measurement | Immigrants from England | Yugoslavian |
| Minimum | 4.7% | 4.2% |
| Maximum | 69.2% | 48.9% |
| Range | 64.4% | 44.8% |
| Mean | 20.5% | 15.7% |
| Median | 15.5% | 12.6% |
| Interquartile 25% (IQ1) | 11.8% | 11.2% |
| Interquartile 75% (IQ3) | 25.5% | 15.1% |
| Interquartile Range (IQR) | 13.6% | 3.9% |
| Standard Deviation (Sample) | 13.5% | 9.5% |
| Standard Deviation (Population) | 13.3% | 9.4% |
Demographics Similar to Immigrants from England and Yugoslavians by Male Disability
In terms of male disability, the demographic groups most similar to Immigrants from England are Panamanian (11.7%, a difference of 0.060%), Immigrants from Western Europe (11.7%, a difference of 0.070%), Immigrants from Congo (11.7%, a difference of 0.080%), Alsatian (11.7%, a difference of 0.23%), and Immigrants from Bahamas (11.7%, a difference of 0.32%). Similarly, the demographic groups most similar to Yugoslavians are Carpatho Rusyn (11.9%, a difference of 0.10%), U.S. Virgin Islander (11.9%, a difference of 0.11%), Immigrants from North America (11.9%, a difference of 0.25%), Immigrants from Canada (11.9%, a difference of 0.37%), and Mexican (11.8%, a difference of 0.45%).
| Demographics | Rating | Rank | Male Disability |
| Immigrants | England | 4.0 /100 | #218 | Tragic 11.7% |
| Panamanians | 3.8 /100 | #219 | Tragic 11.7% |
| Immigrants | Western Europe | 3.8 /100 | #220 | Tragic 11.7% |
| Immigrants | Congo | 3.7 /100 | #221 | Tragic 11.7% |
| Alsatians | 3.3 /100 | #222 | Tragic 11.7% |
| Immigrants | Bahamas | 3.2 /100 | #223 | Tragic 11.7% |
| Japanese | 3.1 /100 | #224 | Tragic 11.7% |
| Liberians | 3.1 /100 | #225 | Tragic 11.8% |
| Sub-Saharan Africans | 2.8 /100 | #226 | Tragic 11.8% |
| Austrians | 2.5 /100 | #227 | Tragic 11.8% |
| Hispanics or Latinos | 2.3 /100 | #228 | Tragic 11.8% |
| Bermudans | 2.3 /100 | #229 | Tragic 11.8% |
| Croatians | 2.1 /100 | #230 | Tragic 11.8% |
| Dominicans | 1.8 /100 | #231 | Tragic 11.8% |
| Malaysians | 1.8 /100 | #232 | Tragic 11.8% |
| Mexicans | 1.7 /100 | #233 | Tragic 11.8% |
| Immigrants | Canada | 1.6 /100 | #234 | Tragic 11.9% |
| Immigrants | North America | 1.5 /100 | #235 | Tragic 11.9% |
| U.S. Virgin Islanders | 1.3 /100 | #236 | Tragic 11.9% |
| Carpatho Rusyns | 1.3 /100 | #237 | Tragic 11.9% |
| Yugoslavians | 1.2 /100 | #238 | Tragic 11.9% |