Immigrants from El Salvador vs Sioux Disability Age Over 75
COMPARE
Immigrants from El Salvador
Sioux
Disability Age Over 75
Disability Age Over 75 Comparison
Immigrants from El Salvador
Sioux
49.0%
DISABILITY AGE OVER 75
0.2/ 100
METRIC RATING
269th/ 347
METRIC RANK
49.7%
DISABILITY AGE OVER 75
0.0/ 100
METRIC RATING
287th/ 347
METRIC RANK
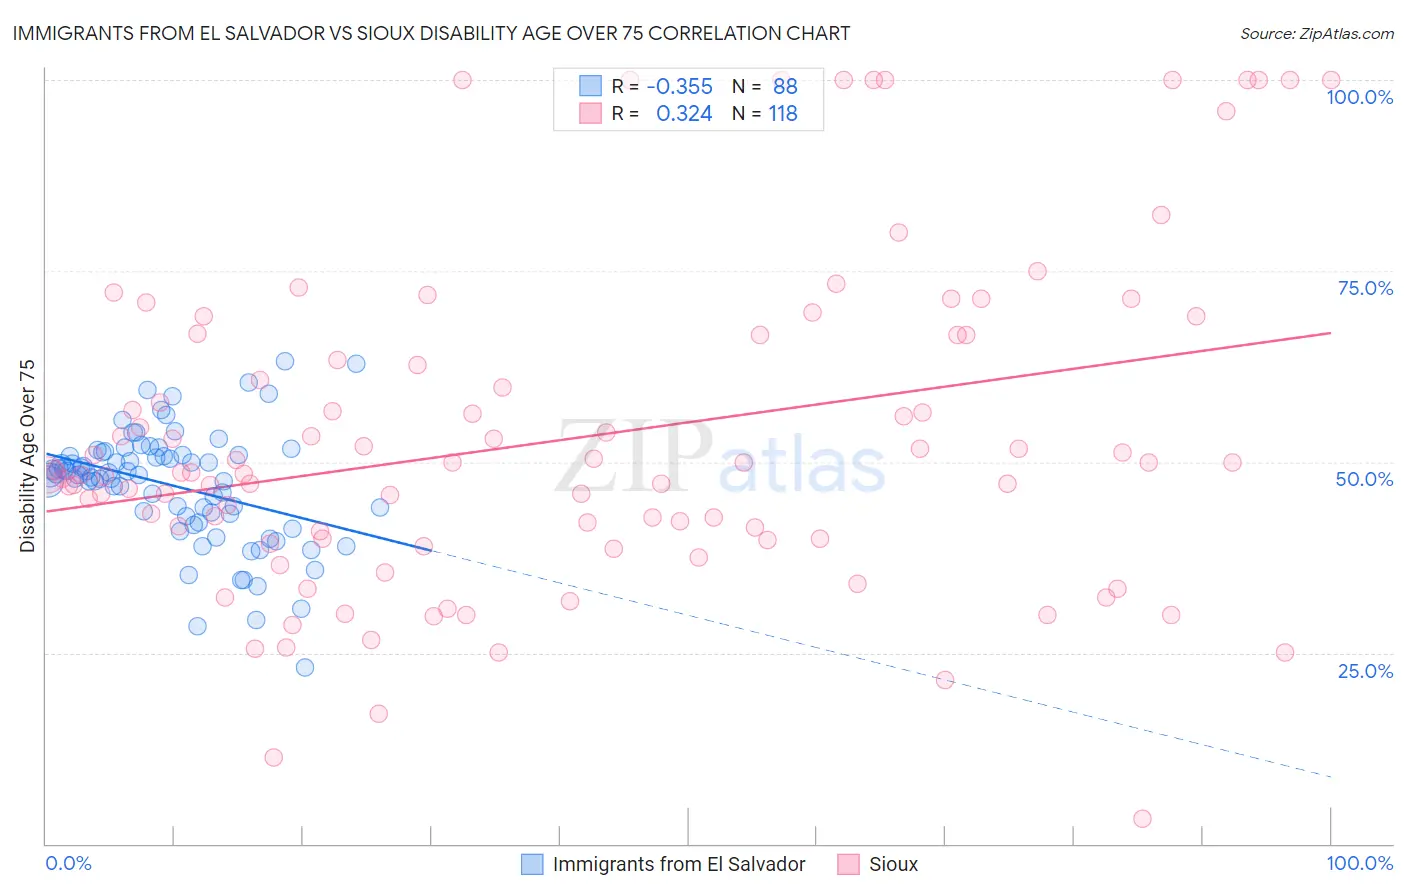
Immigrants from El Salvador vs Sioux Disability Age Over 75 Correlation Chart
The statistical analysis conducted on geographies consisting of 357,354,548 people shows a mild negative correlation between the proportion of Immigrants from El Salvador and percentage of population with a disability over the age of 75 in the United States with a correlation coefficient (R) of -0.355 and weighted average of 49.0%. Similarly, the statistical analysis conducted on geographies consisting of 233,802,290 people shows a mild positive correlation between the proportion of Sioux and percentage of population with a disability over the age of 75 in the United States with a correlation coefficient (R) of 0.324 and weighted average of 49.7%, a difference of 1.5%.
Disability Age Over 75 Correlation Summary
| Measurement | Immigrants from El Salvador | Sioux |
| Minimum | 23.1% | 3.3% |
| Maximum | 63.2% | 100.0% |
| Range | 40.1% | 96.7% |
| Mean | 46.9% | 53.0% |
| Median | 48.3% | 48.6% |
| Interquartile 25% (IQ1) | 43.0% | 40.0% |
| Interquartile 75% (IQ3) | 50.9% | 66.7% |
| Interquartile Range (IQR) | 7.9% | 26.7% |
| Standard Deviation (Sample) | 7.5% | 21.3% |
| Standard Deviation (Population) | 7.4% | 21.2% |
Demographics Similar to Immigrants from El Salvador and Sioux by Disability Age Over 75
In terms of disability age over 75, the demographic groups most similar to Immigrants from El Salvador are Guatemalan (49.0%, a difference of 0.020%), Potawatomi (49.0%, a difference of 0.030%), Fijian (49.0%, a difference of 0.050%), Assyrian/Chaldean/Syriac (49.1%, a difference of 0.060%), and Immigrants from Iraq (49.1%, a difference of 0.11%). Similarly, the demographic groups most similar to Sioux are Yaqui (49.8%, a difference of 0.050%), Immigrants from Belize (49.6%, a difference of 0.21%), Crow (49.6%, a difference of 0.29%), Immigrants from Latin America (49.5%, a difference of 0.43%), and Samoan (49.5%, a difference of 0.48%).
| Demographics | Rating | Rank | Disability Age Over 75 |
| Guatemalans | 0.2 /100 | #268 | Tragic 49.0% |
| Immigrants | El Salvador | 0.2 /100 | #269 | Tragic 49.0% |
| Potawatomi | 0.2 /100 | #270 | Tragic 49.0% |
| Fijians | 0.2 /100 | #271 | Tragic 49.0% |
| Assyrians/Chaldeans/Syriacs | 0.2 /100 | #272 | Tragic 49.1% |
| Immigrants | Iraq | 0.1 /100 | #273 | Tragic 49.1% |
| Immigrants | Guatemala | 0.1 /100 | #274 | Tragic 49.1% |
| Immigrants | Dominica | 0.1 /100 | #275 | Tragic 49.1% |
| Immigrants | Uzbekistan | 0.1 /100 | #276 | Tragic 49.2% |
| Hawaiians | 0.1 /100 | #277 | Tragic 49.2% |
| Immigrants | Laos | 0.1 /100 | #278 | Tragic 49.2% |
| Guamanians/Chamorros | 0.0 /100 | #279 | Tragic 49.4% |
| Bangladeshis | 0.0 /100 | #280 | Tragic 49.4% |
| Belizeans | 0.0 /100 | #281 | Tragic 49.4% |
| Blacks/African Americans | 0.0 /100 | #282 | Tragic 49.5% |
| Samoans | 0.0 /100 | #283 | Tragic 49.5% |
| Immigrants | Latin America | 0.0 /100 | #284 | Tragic 49.5% |
| Crow | 0.0 /100 | #285 | Tragic 49.6% |
| Immigrants | Belize | 0.0 /100 | #286 | Tragic 49.6% |
| Sioux | 0.0 /100 | #287 | Tragic 49.7% |
| Yaqui | 0.0 /100 | #288 | Tragic 49.8% |