Immigrants from El Salvador vs Immigrants from Cambodia Disability Age Over 75
COMPARE
Immigrants from El Salvador
Immigrants from Cambodia
Disability Age Over 75
Disability Age Over 75 Comparison
Immigrants from El Salvador
Immigrants from Cambodia
49.0%
DISABILITY AGE OVER 75
0.2/ 100
METRIC RATING
269th/ 347
METRIC RANK
50.0%
DISABILITY AGE OVER 75
0.0/ 100
METRIC RATING
294th/ 347
METRIC RANK
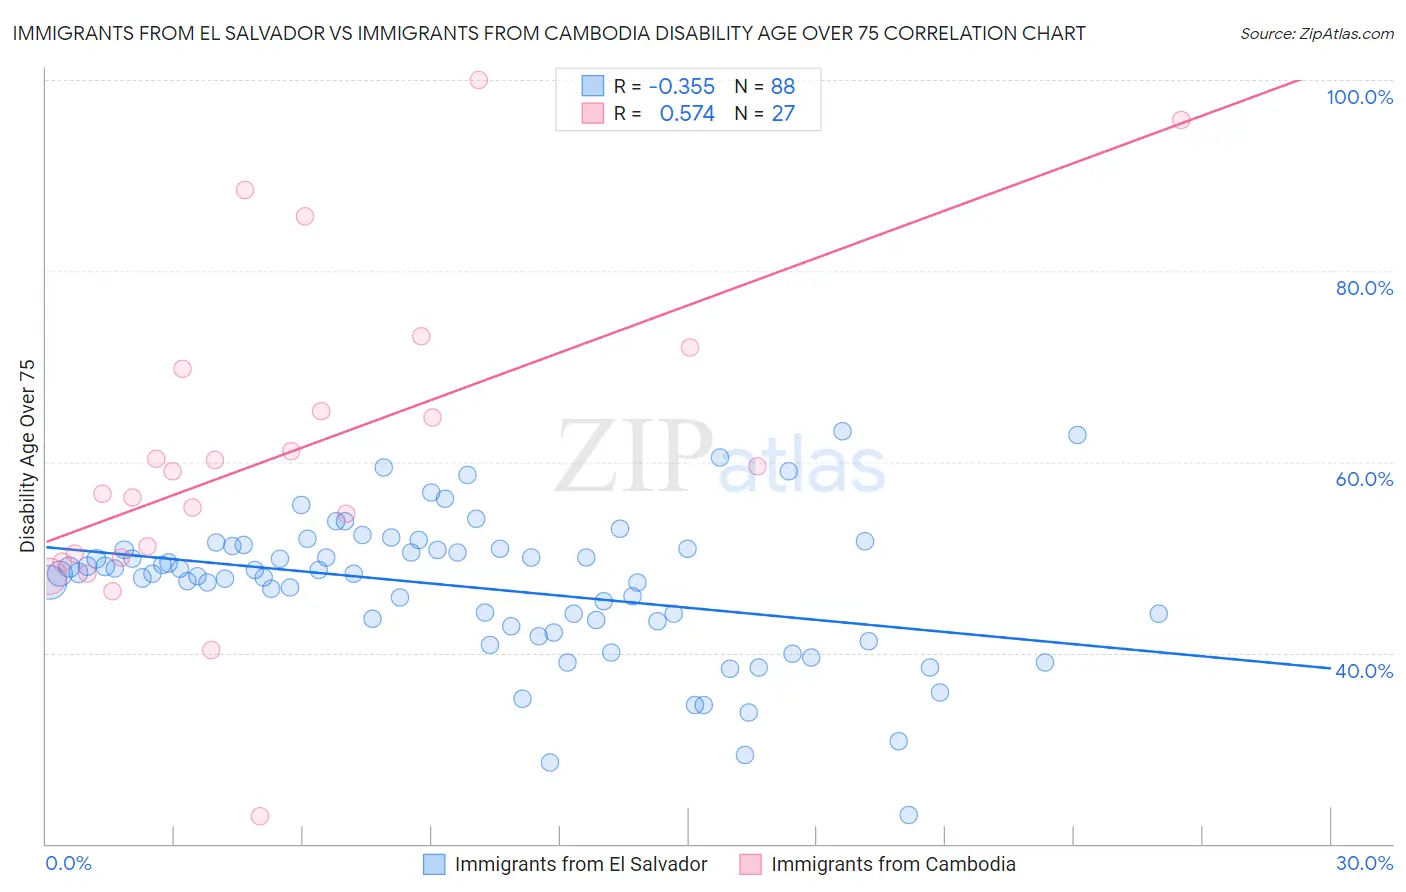
Immigrants from El Salvador vs Immigrants from Cambodia Disability Age Over 75 Correlation Chart
The statistical analysis conducted on geographies consisting of 357,354,548 people shows a mild negative correlation between the proportion of Immigrants from El Salvador and percentage of population with a disability over the age of 75 in the United States with a correlation coefficient (R) of -0.355 and weighted average of 49.0%. Similarly, the statistical analysis conducted on geographies consisting of 205,096,064 people shows a substantial positive correlation between the proportion of Immigrants from Cambodia and percentage of population with a disability over the age of 75 in the United States with a correlation coefficient (R) of 0.574 and weighted average of 50.0%, a difference of 2.0%.
Disability Age Over 75 Correlation Summary
| Measurement | Immigrants from El Salvador | Immigrants from Cambodia |
| Minimum | 23.1% | 22.9% |
| Maximum | 63.2% | 100.0% |
| Range | 40.1% | 77.1% |
| Mean | 46.9% | 60.9% |
| Median | 48.3% | 59.1% |
| Interquartile 25% (IQ1) | 43.0% | 50.0% |
| Interquartile 75% (IQ3) | 50.9% | 69.8% |
| Interquartile Range (IQR) | 7.9% | 19.8% |
| Standard Deviation (Sample) | 7.5% | 17.0% |
| Standard Deviation (Population) | 7.4% | 16.7% |
Similar Demographics by Disability Age Over 75
Demographics Similar to Immigrants from El Salvador by Disability Age Over 75
In terms of disability age over 75, the demographic groups most similar to Immigrants from El Salvador are Guatemalan (49.0%, a difference of 0.020%), Potawatomi (49.0%, a difference of 0.030%), Malaysian (49.0%, a difference of 0.040%), Fijian (49.0%, a difference of 0.050%), and Assyrian/Chaldean/Syriac (49.1%, a difference of 0.060%).
| Demographics | Rating | Rank | Disability Age Over 75 |
| Immigrants | West Indies | 0.3 /100 | #262 | Tragic 48.9% |
| Salvadorans | 0.3 /100 | #263 | Tragic 48.9% |
| Immigrants | Honduras | 0.3 /100 | #264 | Tragic 48.9% |
| Hondurans | 0.3 /100 | #265 | Tragic 48.9% |
| U.S. Virgin Islanders | 0.2 /100 | #266 | Tragic 48.9% |
| Malaysians | 0.2 /100 | #267 | Tragic 49.0% |
| Guatemalans | 0.2 /100 | #268 | Tragic 49.0% |
| Immigrants | El Salvador | 0.2 /100 | #269 | Tragic 49.0% |
| Potawatomi | 0.2 /100 | #270 | Tragic 49.0% |
| Fijians | 0.2 /100 | #271 | Tragic 49.0% |
| Assyrians/Chaldeans/Syriacs | 0.2 /100 | #272 | Tragic 49.1% |
| Immigrants | Iraq | 0.1 /100 | #273 | Tragic 49.1% |
| Immigrants | Guatemala | 0.1 /100 | #274 | Tragic 49.1% |
| Immigrants | Dominica | 0.1 /100 | #275 | Tragic 49.1% |
| Immigrants | Uzbekistan | 0.1 /100 | #276 | Tragic 49.2% |
Demographics Similar to Immigrants from Cambodia by Disability Age Over 75
In terms of disability age over 75, the demographic groups most similar to Immigrants from Cambodia are Spanish American (50.0%, a difference of 0.040%), Mexican American Indian (50.0%, a difference of 0.080%), Armenian (50.0%, a difference of 0.10%), Spanish American Indian (49.9%, a difference of 0.12%), and Marshallese (50.1%, a difference of 0.16%).
| Demographics | Rating | Rank | Disability Age Over 75 |
| Sioux | 0.0 /100 | #287 | Tragic 49.7% |
| Yaqui | 0.0 /100 | #288 | Tragic 49.8% |
| Osage | 0.0 /100 | #289 | Tragic 49.8% |
| Puget Sound Salish | 0.0 /100 | #290 | Tragic 49.8% |
| Arapaho | 0.0 /100 | #291 | Tragic 49.8% |
| Shoshone | 0.0 /100 | #292 | Tragic 49.9% |
| Spanish American Indians | 0.0 /100 | #293 | Tragic 49.9% |
| Immigrants | Cambodia | 0.0 /100 | #294 | Tragic 50.0% |
| Spanish Americans | 0.0 /100 | #295 | Tragic 50.0% |
| Mexican American Indians | 0.0 /100 | #296 | Tragic 50.0% |
| Armenians | 0.0 /100 | #297 | Tragic 50.0% |
| Marshallese | 0.0 /100 | #298 | Tragic 50.1% |
| Immigrants | Micronesia | 0.0 /100 | #299 | Tragic 50.1% |
| Cape Verdeans | 0.0 /100 | #300 | Tragic 50.1% |
| Dominicans | 0.0 /100 | #301 | Tragic 50.2% |