Immigrants from El Salvador vs Immigrants from Barbados Disability Age Over 75
COMPARE
Immigrants from El Salvador
Immigrants from Barbados
Disability Age Over 75
Disability Age Over 75 Comparison
Immigrants from El Salvador
Immigrants from Barbados
49.0%
DISABILITY AGE OVER 75
0.2/ 100
METRIC RATING
269th/ 347
METRIC RANK
47.9%
DISABILITY AGE OVER 75
10.7/ 100
METRIC RATING
214th/ 347
METRIC RANK
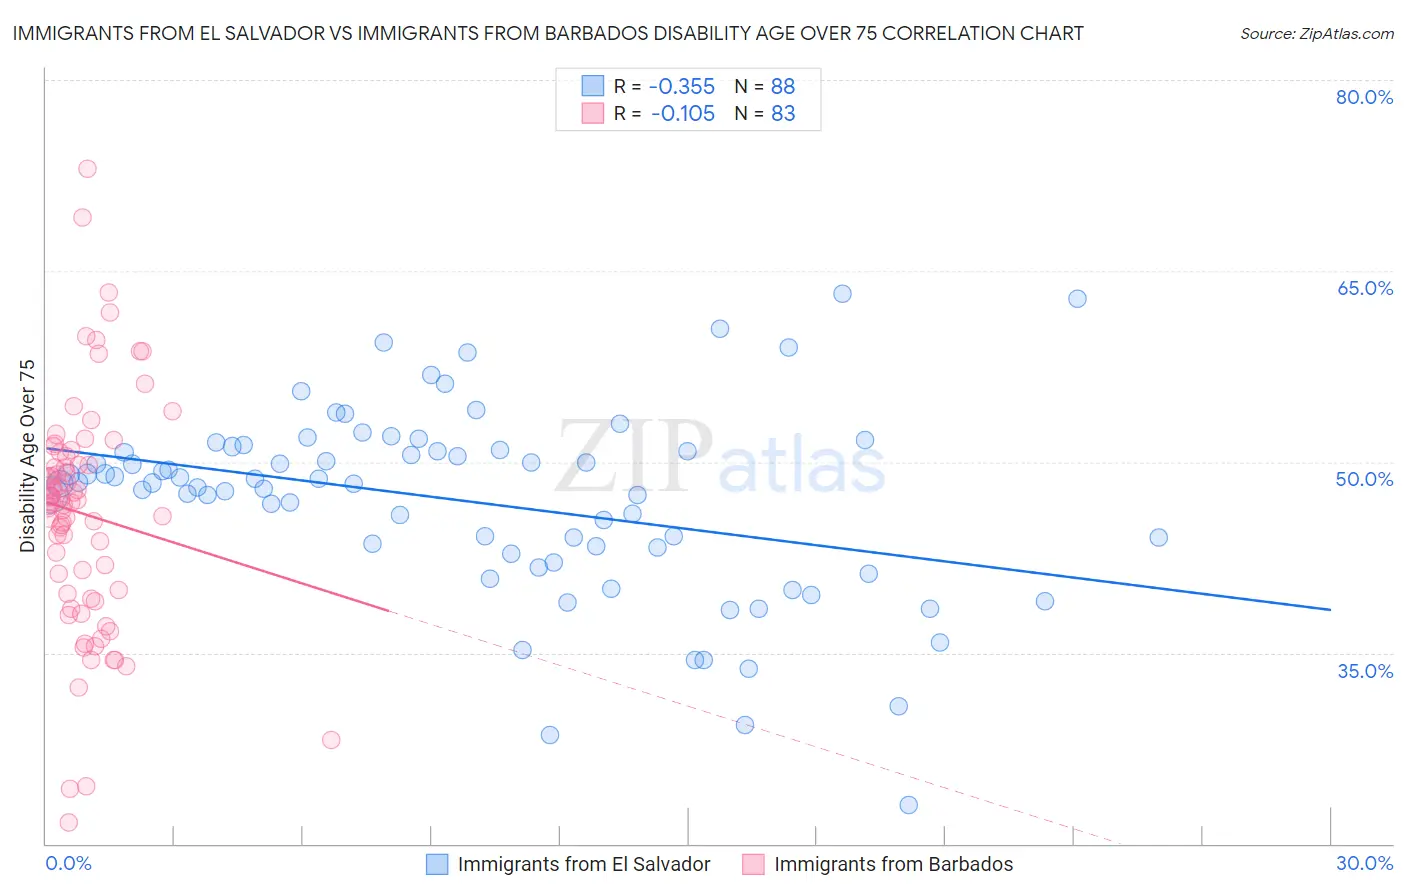
Immigrants from El Salvador vs Immigrants from Barbados Disability Age Over 75 Correlation Chart
The statistical analysis conducted on geographies consisting of 357,354,548 people shows a mild negative correlation between the proportion of Immigrants from El Salvador and percentage of population with a disability over the age of 75 in the United States with a correlation coefficient (R) of -0.355 and weighted average of 49.0%. Similarly, the statistical analysis conducted on geographies consisting of 112,754,830 people shows a poor negative correlation between the proportion of Immigrants from Barbados and percentage of population with a disability over the age of 75 in the United States with a correlation coefficient (R) of -0.105 and weighted average of 47.9%, a difference of 2.3%.
Disability Age Over 75 Correlation Summary
| Measurement | Immigrants from El Salvador | Immigrants from Barbados |
| Minimum | 23.1% | 21.7% |
| Maximum | 63.2% | 73.0% |
| Range | 40.1% | 51.3% |
| Mean | 46.9% | 45.9% |
| Median | 48.3% | 46.8% |
| Interquartile 25% (IQ1) | 43.0% | 39.6% |
| Interquartile 75% (IQ3) | 50.9% | 50.4% |
| Interquartile Range (IQR) | 7.9% | 10.8% |
| Standard Deviation (Sample) | 7.5% | 9.2% |
| Standard Deviation (Population) | 7.4% | 9.1% |
Similar Demographics by Disability Age Over 75
Demographics Similar to Immigrants from El Salvador by Disability Age Over 75
In terms of disability age over 75, the demographic groups most similar to Immigrants from El Salvador are Guatemalan (49.0%, a difference of 0.020%), Potawatomi (49.0%, a difference of 0.030%), Malaysian (49.0%, a difference of 0.040%), Fijian (49.0%, a difference of 0.050%), and Assyrian/Chaldean/Syriac (49.1%, a difference of 0.060%).
| Demographics | Rating | Rank | Disability Age Over 75 |
| Immigrants | West Indies | 0.3 /100 | #262 | Tragic 48.9% |
| Salvadorans | 0.3 /100 | #263 | Tragic 48.9% |
| Immigrants | Honduras | 0.3 /100 | #264 | Tragic 48.9% |
| Hondurans | 0.3 /100 | #265 | Tragic 48.9% |
| U.S. Virgin Islanders | 0.2 /100 | #266 | Tragic 48.9% |
| Malaysians | 0.2 /100 | #267 | Tragic 49.0% |
| Guatemalans | 0.2 /100 | #268 | Tragic 49.0% |
| Immigrants | El Salvador | 0.2 /100 | #269 | Tragic 49.0% |
| Potawatomi | 0.2 /100 | #270 | Tragic 49.0% |
| Fijians | 0.2 /100 | #271 | Tragic 49.0% |
| Assyrians/Chaldeans/Syriacs | 0.2 /100 | #272 | Tragic 49.1% |
| Immigrants | Iraq | 0.1 /100 | #273 | Tragic 49.1% |
| Immigrants | Guatemala | 0.1 /100 | #274 | Tragic 49.1% |
| Immigrants | Dominica | 0.1 /100 | #275 | Tragic 49.1% |
| Immigrants | Uzbekistan | 0.1 /100 | #276 | Tragic 49.2% |
Demographics Similar to Immigrants from Barbados by Disability Age Over 75
In terms of disability age over 75, the demographic groups most similar to Immigrants from Barbados are Senegalese (47.9%, a difference of 0.0%), Immigrants from Panama (47.9%, a difference of 0.030%), Laotian (47.9%, a difference of 0.040%), Panamanian (47.9%, a difference of 0.060%), and Immigrants from Burma/Myanmar (47.9%, a difference of 0.060%).
| Demographics | Rating | Rank | Disability Age Over 75 |
| Immigrants | Syria | 17.4 /100 | #207 | Poor 47.8% |
| Immigrants | Senegal | 16.9 /100 | #208 | Poor 47.8% |
| Immigrants | Indonesia | 14.2 /100 | #209 | Poor 47.8% |
| Vietnamese | 11.9 /100 | #210 | Poor 47.9% |
| Panamanians | 11.8 /100 | #211 | Poor 47.9% |
| Immigrants | Burma/Myanmar | 11.7 /100 | #212 | Poor 47.9% |
| Laotians | 11.5 /100 | #213 | Poor 47.9% |
| Immigrants | Barbados | 10.7 /100 | #214 | Poor 47.9% |
| Senegalese | 10.7 /100 | #215 | Poor 47.9% |
| Immigrants | Panama | 10.2 /100 | #216 | Poor 47.9% |
| Immigrants | Grenada | 9.4 /100 | #217 | Tragic 47.9% |
| Immigrants | Western Africa | 8.3 /100 | #218 | Tragic 48.0% |
| Immigrants | Western Asia | 7.5 /100 | #219 | Tragic 48.0% |
| Bahamians | 7.4 /100 | #220 | Tragic 48.0% |
| Immigrants | Oceania | 7.3 /100 | #221 | Tragic 48.0% |