Immigrants from Fiji vs Sioux Disability Age Over 75
COMPARE
Immigrants from Fiji
Sioux
Disability Age Over 75
Disability Age Over 75 Comparison
Immigrants from Fiji
Sioux
50.6%
DISABILITY AGE OVER 75
0.0/ 100
METRIC RATING
307th/ 347
METRIC RANK
49.7%
DISABILITY AGE OVER 75
0.0/ 100
METRIC RATING
287th/ 347
METRIC RANK
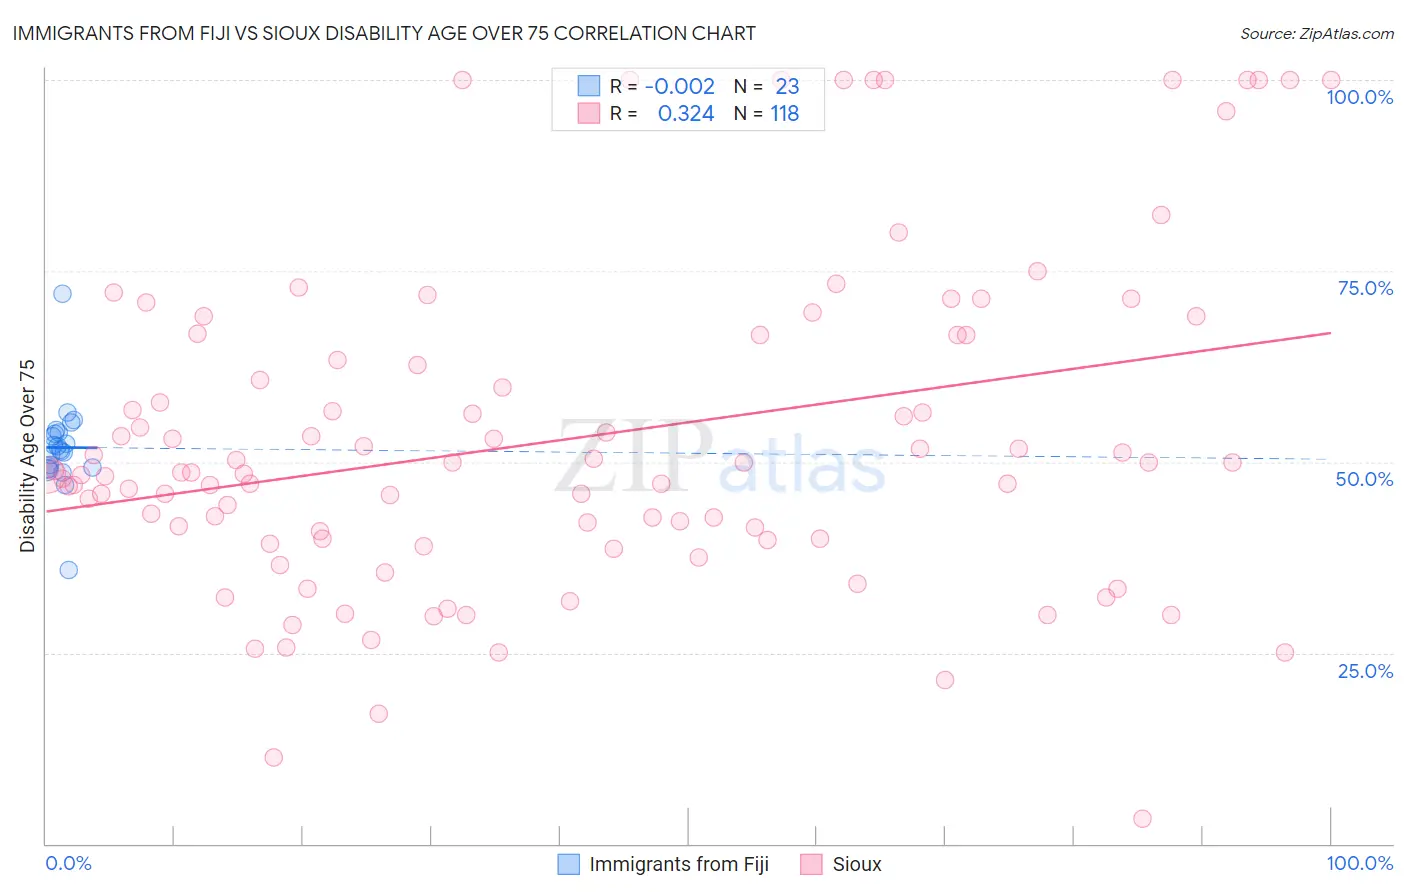
Immigrants from Fiji vs Sioux Disability Age Over 75 Correlation Chart
The statistical analysis conducted on geographies consisting of 93,724,522 people shows no correlation between the proportion of Immigrants from Fiji and percentage of population with a disability over the age of 75 in the United States with a correlation coefficient (R) of -0.002 and weighted average of 50.6%. Similarly, the statistical analysis conducted on geographies consisting of 233,802,290 people shows a mild positive correlation between the proportion of Sioux and percentage of population with a disability over the age of 75 in the United States with a correlation coefficient (R) of 0.324 and weighted average of 49.7%, a difference of 1.7%.
Disability Age Over 75 Correlation Summary
| Measurement | Immigrants from Fiji | Sioux |
| Minimum | 35.9% | 3.3% |
| Maximum | 72.0% | 100.0% |
| Range | 36.1% | 96.7% |
| Mean | 51.9% | 53.0% |
| Median | 51.5% | 48.6% |
| Interquartile 25% (IQ1) | 49.1% | 40.0% |
| Interquartile 75% (IQ3) | 53.8% | 66.7% |
| Interquartile Range (IQR) | 4.7% | 26.7% |
| Standard Deviation (Sample) | 6.0% | 21.3% |
| Standard Deviation (Population) | 5.9% | 21.2% |
Demographics Similar to Immigrants from Fiji and Sioux by Disability Age Over 75
In terms of disability age over 75, the demographic groups most similar to Immigrants from Fiji are Immigrants from Central America (50.5%, a difference of 0.060%), Central American Indian (50.5%, a difference of 0.15%), Immigrants from Dominican Republic (50.3%, a difference of 0.56%), Japanese (50.2%, a difference of 0.67%), and Cherokee (50.2%, a difference of 0.68%). Similarly, the demographic groups most similar to Sioux are Yaqui (49.8%, a difference of 0.050%), Osage (49.8%, a difference of 0.13%), Puget Sound Salish (49.8%, a difference of 0.14%), Arapaho (49.8%, a difference of 0.14%), and Shoshone (49.9%, a difference of 0.21%).
| Demographics | Rating | Rank | Disability Age Over 75 |
| Sioux | 0.0 /100 | #287 | Tragic 49.7% |
| Yaqui | 0.0 /100 | #288 | Tragic 49.8% |
| Osage | 0.0 /100 | #289 | Tragic 49.8% |
| Puget Sound Salish | 0.0 /100 | #290 | Tragic 49.8% |
| Arapaho | 0.0 /100 | #291 | Tragic 49.8% |
| Shoshone | 0.0 /100 | #292 | Tragic 49.9% |
| Spanish American Indians | 0.0 /100 | #293 | Tragic 49.9% |
| Immigrants | Cambodia | 0.0 /100 | #294 | Tragic 50.0% |
| Spanish Americans | 0.0 /100 | #295 | Tragic 50.0% |
| Mexican American Indians | 0.0 /100 | #296 | Tragic 50.0% |
| Armenians | 0.0 /100 | #297 | Tragic 50.0% |
| Marshallese | 0.0 /100 | #298 | Tragic 50.1% |
| Immigrants | Micronesia | 0.0 /100 | #299 | Tragic 50.1% |
| Cape Verdeans | 0.0 /100 | #300 | Tragic 50.1% |
| Dominicans | 0.0 /100 | #301 | Tragic 50.2% |
| Cherokee | 0.0 /100 | #302 | Tragic 50.2% |
| Japanese | 0.0 /100 | #303 | Tragic 50.2% |
| Immigrants | Dominican Republic | 0.0 /100 | #304 | Tragic 50.3% |
| Central American Indians | 0.0 /100 | #305 | Tragic 50.5% |
| Immigrants | Central America | 0.0 /100 | #306 | Tragic 50.5% |
| Immigrants | Fiji | 0.0 /100 | #307 | Tragic 50.6% |