Danish vs Sioux Disability Age Over 75
COMPARE
Danish
Sioux
Disability Age Over 75
Disability Age Over 75 Comparison
Danes
Sioux
46.2%
DISABILITY AGE OVER 75
98.6/ 100
METRIC RATING
87th/ 347
METRIC RANK
49.7%
DISABILITY AGE OVER 75
0.0/ 100
METRIC RATING
287th/ 347
METRIC RANK
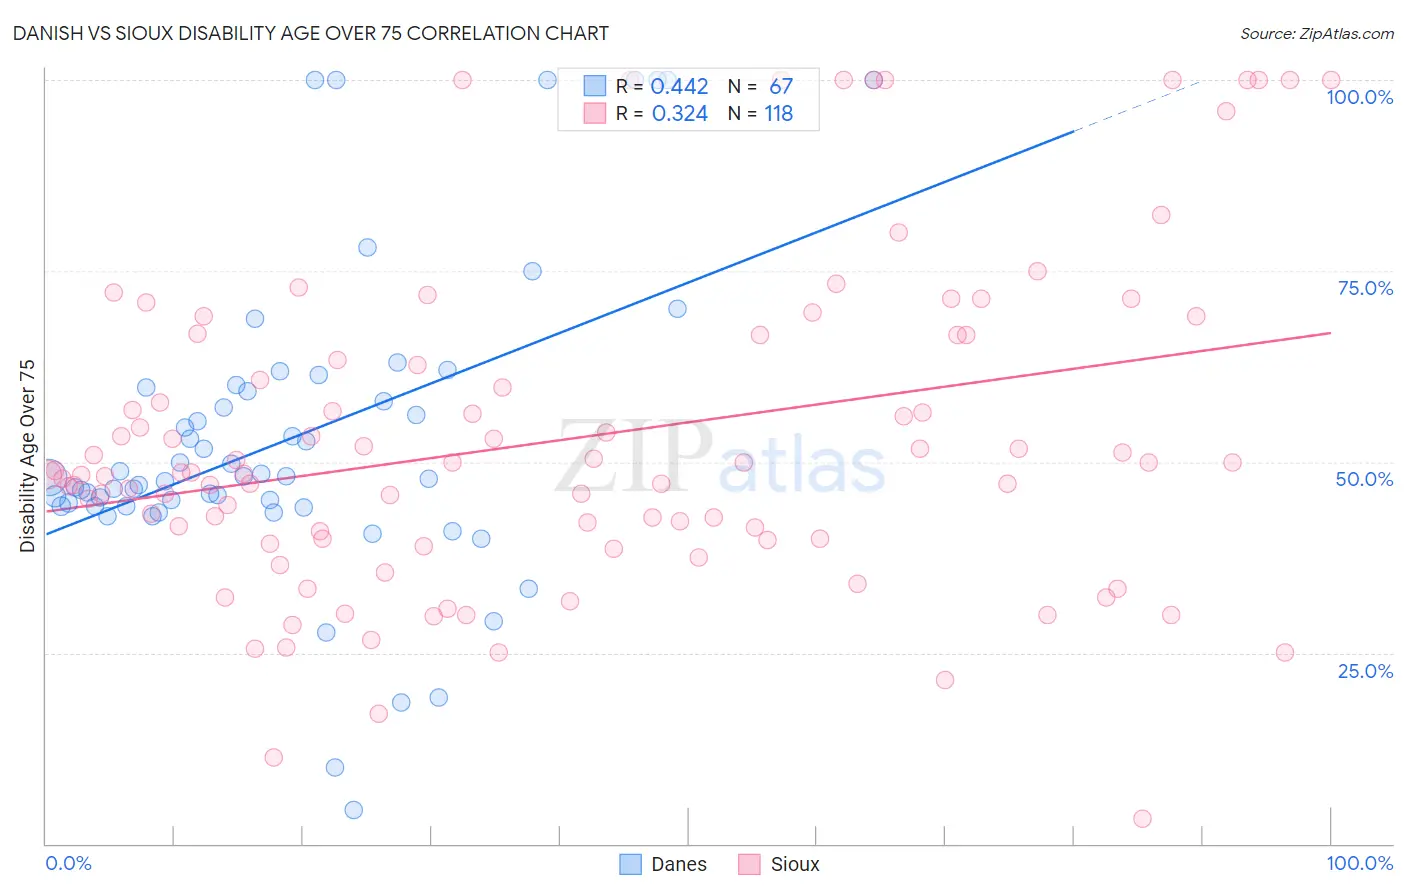
Danish vs Sioux Disability Age Over 75 Correlation Chart
The statistical analysis conducted on geographies consisting of 473,146,755 people shows a moderate positive correlation between the proportion of Danes and percentage of population with a disability over the age of 75 in the United States with a correlation coefficient (R) of 0.442 and weighted average of 46.2%. Similarly, the statistical analysis conducted on geographies consisting of 233,802,290 people shows a mild positive correlation between the proportion of Sioux and percentage of population with a disability over the age of 75 in the United States with a correlation coefficient (R) of 0.324 and weighted average of 49.7%, a difference of 7.7%.
Disability Age Over 75 Correlation Summary
| Measurement | Danish | Sioux |
| Minimum | 4.4% | 3.3% |
| Maximum | 100.0% | 100.0% |
| Range | 95.6% | 96.7% |
| Mean | 53.1% | 53.0% |
| Median | 47.9% | 48.6% |
| Interquartile 25% (IQ1) | 44.1% | 40.0% |
| Interquartile 75% (IQ3) | 59.7% | 66.7% |
| Interquartile Range (IQR) | 15.6% | 26.7% |
| Standard Deviation (Sample) | 20.5% | 21.3% |
| Standard Deviation (Population) | 20.4% | 21.2% |
Similar Demographics by Disability Age Over 75
Demographics Similar to Danes by Disability Age Over 75
In terms of disability age over 75, the demographic groups most similar to Danes are Romanian (46.2%, a difference of 0.0%), Immigrants from Southern Europe (46.2%, a difference of 0.010%), Immigrants from Jordan (46.2%, a difference of 0.020%), Immigrants from Latvia (46.2%, a difference of 0.040%), and Argentinean (46.2%, a difference of 0.040%).
| Demographics | Rating | Rank | Disability Age Over 75 |
| Soviet Union | 98.8 /100 | #80 | Exceptional 46.2% |
| New Zealanders | 98.8 /100 | #81 | Exceptional 46.2% |
| Immigrants | Latvia | 98.7 /100 | #82 | Exceptional 46.2% |
| Argentineans | 98.7 /100 | #83 | Exceptional 46.2% |
| Immigrants | Jordan | 98.7 /100 | #84 | Exceptional 46.2% |
| Immigrants | Southern Europe | 98.6 /100 | #85 | Exceptional 46.2% |
| Romanians | 98.6 /100 | #86 | Exceptional 46.2% |
| Danes | 98.6 /100 | #87 | Exceptional 46.2% |
| Uruguayans | 98.4 /100 | #88 | Exceptional 46.2% |
| Immigrants | Saudi Arabia | 98.4 /100 | #89 | Exceptional 46.3% |
| Northern Europeans | 98.3 /100 | #90 | Exceptional 46.3% |
| Immigrants | Egypt | 98.3 /100 | #91 | Exceptional 46.3% |
| Germans | 98.2 /100 | #92 | Exceptional 46.3% |
| Ugandans | 98.2 /100 | #93 | Exceptional 46.3% |
| Albanians | 98.1 /100 | #94 | Exceptional 46.3% |
Demographics Similar to Sioux by Disability Age Over 75
In terms of disability age over 75, the demographic groups most similar to Sioux are Yaqui (49.8%, a difference of 0.050%), Osage (49.8%, a difference of 0.13%), Puget Sound Salish (49.8%, a difference of 0.14%), Arapaho (49.8%, a difference of 0.14%), and Immigrants from Belize (49.6%, a difference of 0.21%).
| Demographics | Rating | Rank | Disability Age Over 75 |
| Bangladeshis | 0.0 /100 | #280 | Tragic 49.4% |
| Belizeans | 0.0 /100 | #281 | Tragic 49.4% |
| Blacks/African Americans | 0.0 /100 | #282 | Tragic 49.5% |
| Samoans | 0.0 /100 | #283 | Tragic 49.5% |
| Immigrants | Latin America | 0.0 /100 | #284 | Tragic 49.5% |
| Crow | 0.0 /100 | #285 | Tragic 49.6% |
| Immigrants | Belize | 0.0 /100 | #286 | Tragic 49.6% |
| Sioux | 0.0 /100 | #287 | Tragic 49.7% |
| Yaqui | 0.0 /100 | #288 | Tragic 49.8% |
| Osage | 0.0 /100 | #289 | Tragic 49.8% |
| Puget Sound Salish | 0.0 /100 | #290 | Tragic 49.8% |
| Arapaho | 0.0 /100 | #291 | Tragic 49.8% |
| Shoshone | 0.0 /100 | #292 | Tragic 49.9% |
| Spanish American Indians | 0.0 /100 | #293 | Tragic 49.9% |
| Immigrants | Cambodia | 0.0 /100 | #294 | Tragic 50.0% |