Immigrants from El Salvador vs Bangladeshi Male Disability
COMPARE
Immigrants from El Salvador
Bangladeshi
Male Disability
Male Disability Comparison
Immigrants from El Salvador
Bangladeshis
10.3%
MALE DISABILITY
99.7/ 100
METRIC RATING
44th/ 347
METRIC RANK
12.0%
MALE DISABILITY
0.5/ 100
METRIC RATING
250th/ 347
METRIC RANK
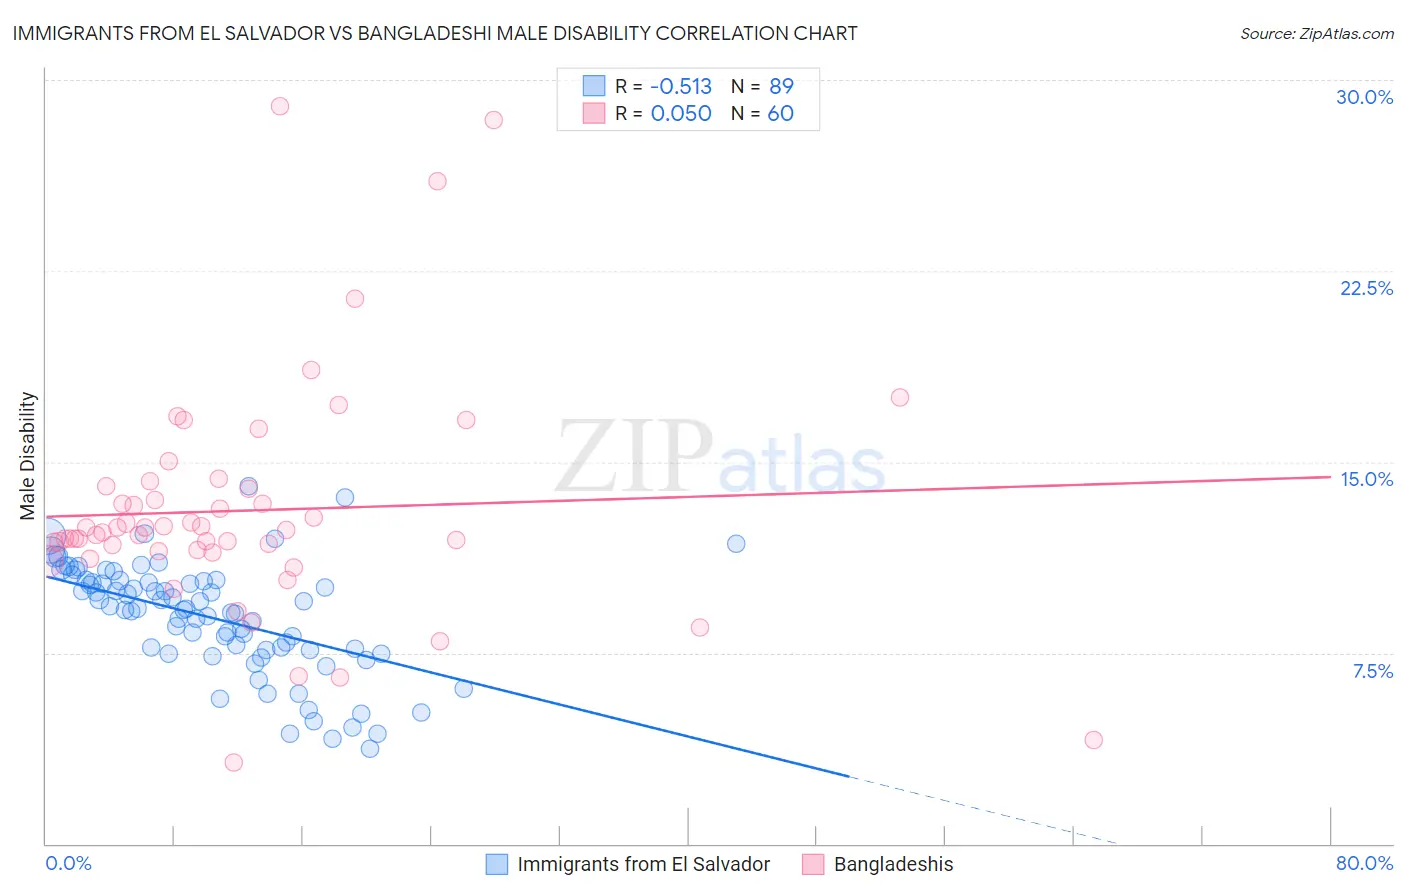
Immigrants from El Salvador vs Bangladeshi Male Disability Correlation Chart
The statistical analysis conducted on geographies consisting of 357,750,884 people shows a substantial negative correlation between the proportion of Immigrants from El Salvador and percentage of males with a disability in the United States with a correlation coefficient (R) of -0.513 and weighted average of 10.3%. Similarly, the statistical analysis conducted on geographies consisting of 141,384,534 people shows a slight positive correlation between the proportion of Bangladeshis and percentage of males with a disability in the United States with a correlation coefficient (R) of 0.050 and weighted average of 12.0%, a difference of 16.8%.
Male Disability Correlation Summary
| Measurement | Immigrants from El Salvador | Bangladeshi |
| Minimum | 3.7% | 3.2% |
| Maximum | 14.1% | 29.0% |
| Range | 10.4% | 25.8% |
| Mean | 8.9% | 13.1% |
| Median | 9.2% | 12.3% |
| Interquartile 25% (IQ1) | 7.6% | 11.5% |
| Interquartile 75% (IQ3) | 10.3% | 14.0% |
| Interquartile Range (IQR) | 2.7% | 2.5% |
| Standard Deviation (Sample) | 2.2% | 4.6% |
| Standard Deviation (Population) | 2.2% | 4.6% |
Similar Demographics by Male Disability
Demographics Similar to Immigrants from El Salvador by Male Disability
In terms of male disability, the demographic groups most similar to Immigrants from El Salvador are Turkish (10.3%, a difference of 0.0%), Immigrants from Bangladesh (10.3%, a difference of 0.070%), Mongolian (10.3%, a difference of 0.090%), Cambodian (10.3%, a difference of 0.090%), and Immigrants from Peru (10.3%, a difference of 0.12%).
| Demographics | Rating | Rank | Male Disability |
| Immigrants | Indonesia | 99.8 /100 | #37 | Exceptional 10.2% |
| Immigrants | Kuwait | 99.8 /100 | #38 | Exceptional 10.2% |
| Afghans | 99.8 /100 | #39 | Exceptional 10.2% |
| Immigrants | Nepal | 99.8 /100 | #40 | Exceptional 10.3% |
| Taiwanese | 99.8 /100 | #41 | Exceptional 10.3% |
| Mongolians | 99.7 /100 | #42 | Exceptional 10.3% |
| Immigrants | Bangladesh | 99.7 /100 | #43 | Exceptional 10.3% |
| Immigrants | El Salvador | 99.7 /100 | #44 | Exceptional 10.3% |
| Turks | 99.7 /100 | #45 | Exceptional 10.3% |
| Cambodians | 99.7 /100 | #46 | Exceptional 10.3% |
| Immigrants | Peru | 99.7 /100 | #47 | Exceptional 10.3% |
| Israelis | 99.7 /100 | #48 | Exceptional 10.3% |
| Immigrants | Spain | 99.7 /100 | #49 | Exceptional 10.3% |
| South Americans | 99.6 /100 | #50 | Exceptional 10.3% |
| Salvadorans | 99.6 /100 | #51 | Exceptional 10.4% |
Demographics Similar to Bangladeshis by Male Disability
In terms of male disability, the demographic groups most similar to Bangladeshis are German Russian (12.0%, a difference of 0.010%), Immigrants from Yemen (12.0%, a difference of 0.050%), Slovene (12.0%, a difference of 0.080%), Guamanian/Chamorro (12.0%, a difference of 0.080%), and British (12.1%, a difference of 0.27%).
| Demographics | Rating | Rank | Male Disability |
| Samoans | 1.1 /100 | #243 | Tragic 11.9% |
| Immigrants | Laos | 1.0 /100 | #244 | Tragic 11.9% |
| Immigrants | Liberia | 1.0 /100 | #245 | Tragic 11.9% |
| Danes | 0.9 /100 | #246 | Tragic 11.9% |
| Hungarians | 0.8 /100 | #247 | Tragic 12.0% |
| Poles | 0.7 /100 | #248 | Tragic 12.0% |
| Immigrants | Yemen | 0.5 /100 | #249 | Tragic 12.0% |
| Bangladeshis | 0.5 /100 | #250 | Tragic 12.0% |
| German Russians | 0.5 /100 | #251 | Tragic 12.0% |
| Slovenes | 0.5 /100 | #252 | Tragic 12.0% |
| Guamanians/Chamorros | 0.5 /100 | #253 | Tragic 12.0% |
| British | 0.4 /100 | #254 | Tragic 12.1% |
| Chinese | 0.4 /100 | #255 | Tragic 12.1% |
| Swiss | 0.3 /100 | #256 | Tragic 12.1% |
| Europeans | 0.3 /100 | #257 | Tragic 12.1% |