Immigrants from El Salvador vs Immigrants from Turkey Male Disability
COMPARE
Immigrants from El Salvador
Immigrants from Turkey
Male Disability
Male Disability Comparison
Immigrants from El Salvador
Immigrants from Turkey
10.3%
MALE DISABILITY
99.7/ 100
METRIC RATING
44th/ 347
METRIC RANK
10.2%
MALE DISABILITY
99.9/ 100
METRIC RATING
34th/ 347
METRIC RANK
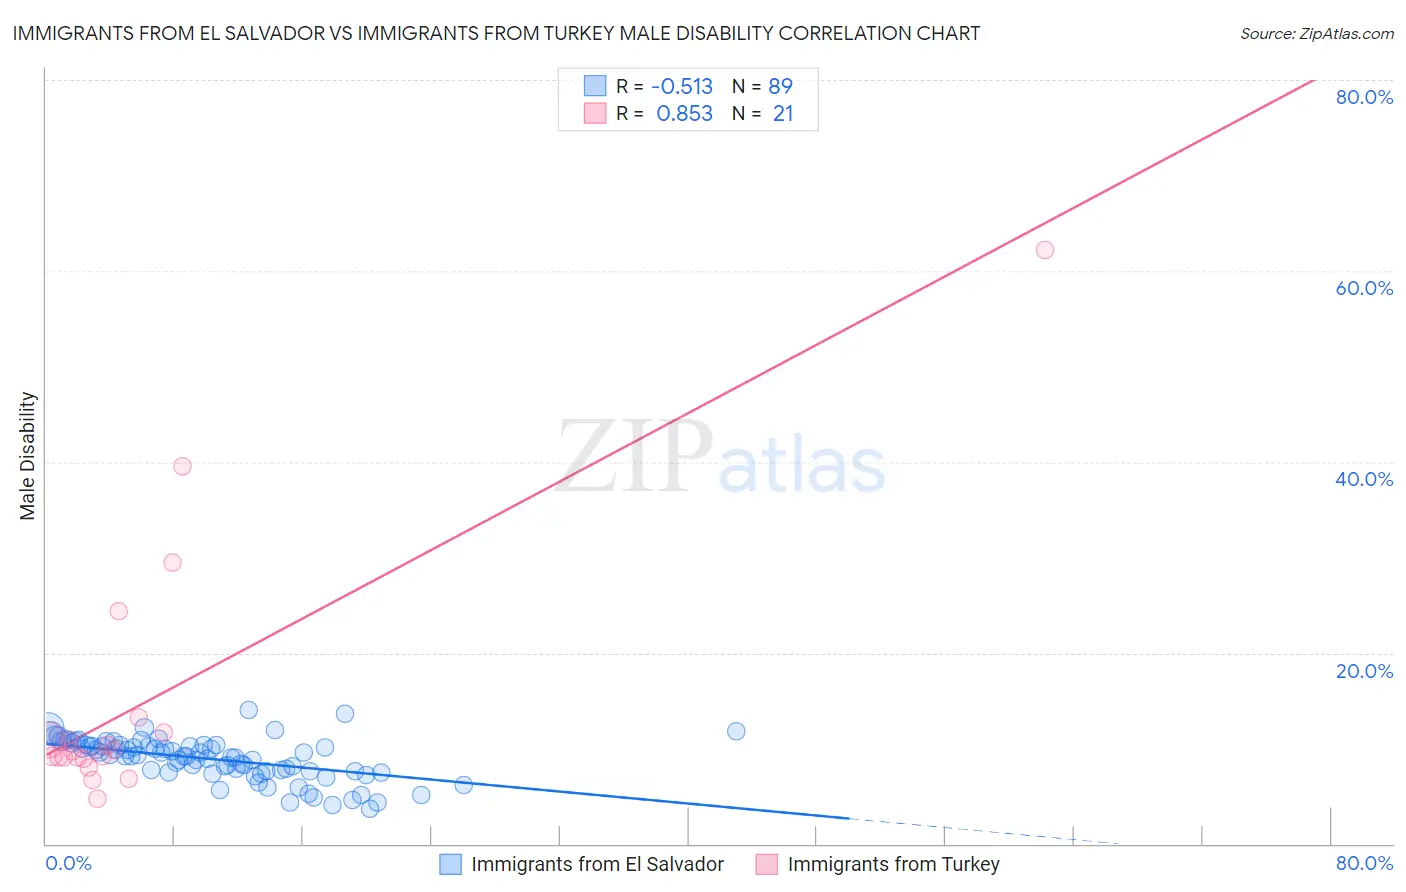
Immigrants from El Salvador vs Immigrants from Turkey Male Disability Correlation Chart
The statistical analysis conducted on geographies consisting of 357,750,884 people shows a substantial negative correlation between the proportion of Immigrants from El Salvador and percentage of males with a disability in the United States with a correlation coefficient (R) of -0.513 and weighted average of 10.3%. Similarly, the statistical analysis conducted on geographies consisting of 223,048,853 people shows a very strong positive correlation between the proportion of Immigrants from Turkey and percentage of males with a disability in the United States with a correlation coefficient (R) of 0.853 and weighted average of 10.2%, a difference of 1.1%.
Male Disability Correlation Summary
| Measurement | Immigrants from El Salvador | Immigrants from Turkey |
| Minimum | 3.7% | 4.8% |
| Maximum | 14.1% | 62.2% |
| Range | 10.4% | 57.4% |
| Mean | 8.9% | 14.9% |
| Median | 9.2% | 9.7% |
| Interquartile 25% (IQ1) | 7.6% | 9.0% |
| Interquartile 75% (IQ3) | 10.3% | 12.5% |
| Interquartile Range (IQR) | 2.7% | 3.5% |
| Standard Deviation (Sample) | 2.2% | 13.7% |
| Standard Deviation (Population) | 2.2% | 13.4% |
Demographics Similar to Immigrants from El Salvador and Immigrants from Turkey by Male Disability
In terms of male disability, the demographic groups most similar to Immigrants from El Salvador are Turkish (10.3%, a difference of 0.0%), Immigrants from Bangladesh (10.3%, a difference of 0.070%), Mongolian (10.3%, a difference of 0.090%), Cambodian (10.3%, a difference of 0.090%), and Immigrants from Peru (10.3%, a difference of 0.12%). Similarly, the demographic groups most similar to Immigrants from Turkey are Immigrants from Ethiopia (10.2%, a difference of 0.060%), Immigrants from Argentina (10.2%, a difference of 0.11%), Ethiopian (10.2%, a difference of 0.16%), Immigrants from Indonesia (10.2%, a difference of 0.24%), and Immigrants from Kuwait (10.2%, a difference of 0.41%).
| Demographics | Rating | Rank | Male Disability |
| Venezuelans | 99.9 /100 | #29 | Exceptional 10.1% |
| Immigrants | Egypt | 99.9 /100 | #30 | Exceptional 10.1% |
| Soviet Union | 99.9 /100 | #31 | Exceptional 10.1% |
| Argentineans | 99.9 /100 | #32 | Exceptional 10.1% |
| Immigrants | Ethiopia | 99.9 /100 | #33 | Exceptional 10.2% |
| Immigrants | Turkey | 99.9 /100 | #34 | Exceptional 10.2% |
| Immigrants | Argentina | 99.9 /100 | #35 | Exceptional 10.2% |
| Ethiopians | 99.8 /100 | #36 | Exceptional 10.2% |
| Immigrants | Indonesia | 99.8 /100 | #37 | Exceptional 10.2% |
| Immigrants | Kuwait | 99.8 /100 | #38 | Exceptional 10.2% |
| Afghans | 99.8 /100 | #39 | Exceptional 10.2% |
| Immigrants | Nepal | 99.8 /100 | #40 | Exceptional 10.3% |
| Taiwanese | 99.8 /100 | #41 | Exceptional 10.3% |
| Mongolians | 99.7 /100 | #42 | Exceptional 10.3% |
| Immigrants | Bangladesh | 99.7 /100 | #43 | Exceptional 10.3% |
| Immigrants | El Salvador | 99.7 /100 | #44 | Exceptional 10.3% |
| Turks | 99.7 /100 | #45 | Exceptional 10.3% |
| Cambodians | 99.7 /100 | #46 | Exceptional 10.3% |
| Immigrants | Peru | 99.7 /100 | #47 | Exceptional 10.3% |
| Israelis | 99.7 /100 | #48 | Exceptional 10.3% |
| Immigrants | Spain | 99.7 /100 | #49 | Exceptional 10.3% |