Immigrants from Ecuador vs Portuguese Ambulatory Disability
COMPARE
Immigrants from Ecuador
Portuguese
Ambulatory Disability
Ambulatory Disability Comparison
Immigrants from Ecuador
Portuguese
6.1%
AMBULATORY DISABILITY
53.8/ 100
METRIC RATING
170th/ 347
METRIC RANK
6.4%
AMBULATORY DISABILITY
4.0/ 100
METRIC RATING
228th/ 347
METRIC RANK
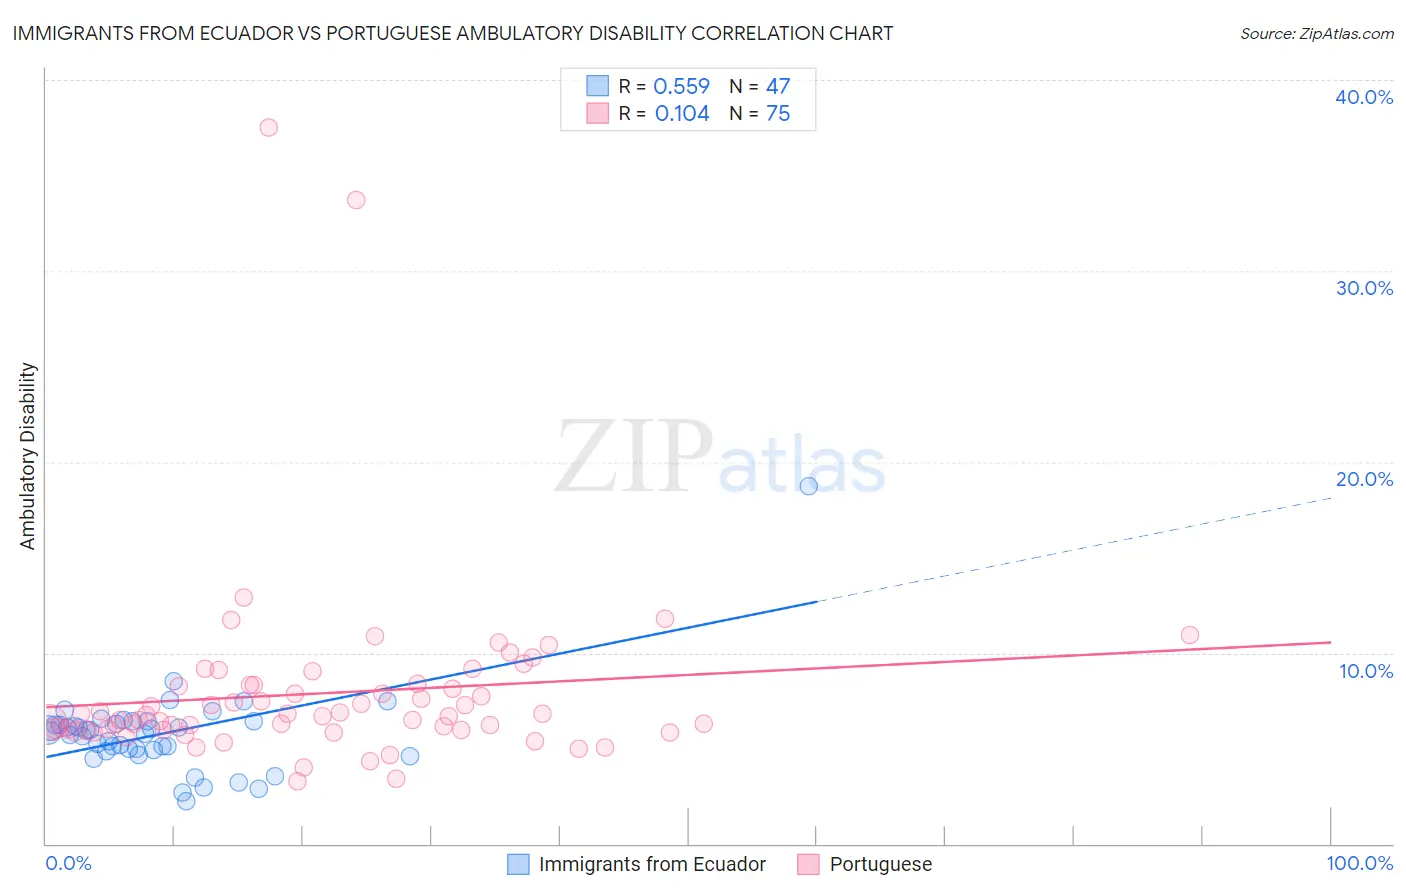
Immigrants from Ecuador vs Portuguese Ambulatory Disability Correlation Chart
The statistical analysis conducted on geographies consisting of 270,935,255 people shows a substantial positive correlation between the proportion of Immigrants from Ecuador and percentage of population with ambulatory disability in the United States with a correlation coefficient (R) of 0.559 and weighted average of 6.1%. Similarly, the statistical analysis conducted on geographies consisting of 450,087,424 people shows a poor positive correlation between the proportion of Portuguese and percentage of population with ambulatory disability in the United States with a correlation coefficient (R) of 0.104 and weighted average of 6.4%, a difference of 4.4%.
Ambulatory Disability Correlation Summary
| Measurement | Immigrants from Ecuador | Portuguese |
| Minimum | 2.2% | 3.3% |
| Maximum | 18.8% | 37.5% |
| Range | 16.5% | 34.2% |
| Mean | 5.8% | 7.9% |
| Median | 5.9% | 6.7% |
| Interquartile 25% (IQ1) | 4.9% | 6.0% |
| Interquartile 75% (IQ3) | 6.4% | 8.3% |
| Interquartile Range (IQR) | 1.5% | 2.3% |
| Standard Deviation (Sample) | 2.4% | 5.0% |
| Standard Deviation (Population) | 2.3% | 5.0% |
Similar Demographics by Ambulatory Disability
Demographics Similar to Immigrants from Ecuador by Ambulatory Disability
In terms of ambulatory disability, the demographic groups most similar to Immigrants from Ecuador are Moroccan (6.1%, a difference of 0.070%), Immigrants from Burma/Myanmar (6.1%, a difference of 0.090%), Croatian (6.1%, a difference of 0.14%), Immigrants from Canada (6.1%, a difference of 0.20%), and Immigrants from Southern Europe (6.1%, a difference of 0.23%).
| Demographics | Rating | Rank | Ambulatory Disability |
| Lebanese | 66.2 /100 | #163 | Good 6.1% |
| Basques | 63.7 /100 | #164 | Good 6.1% |
| Nicaraguans | 63.2 /100 | #165 | Good 6.1% |
| Iraqis | 62.8 /100 | #166 | Good 6.1% |
| Immigrants | Oceania | 60.7 /100 | #167 | Good 6.1% |
| Ecuadorians | 60.5 /100 | #168 | Good 6.1% |
| Immigrants | Southern Europe | 58.1 /100 | #169 | Average 6.1% |
| Immigrants | Ecuador | 53.8 /100 | #170 | Average 6.1% |
| Moroccans | 52.6 /100 | #171 | Average 6.1% |
| Immigrants | Burma/Myanmar | 52.2 /100 | #172 | Average 6.1% |
| Croatians | 51.2 /100 | #173 | Average 6.1% |
| Immigrants | Canada | 50.0 /100 | #174 | Average 6.1% |
| Vietnamese | 47.2 /100 | #175 | Average 6.1% |
| Immigrants | North America | 45.6 /100 | #176 | Average 6.1% |
| Immigrants | England | 45.4 /100 | #177 | Average 6.1% |
Demographics Similar to Portuguese by Ambulatory Disability
In terms of ambulatory disability, the demographic groups most similar to Portuguese are Cuban (6.4%, a difference of 0.010%), Czechoslovakian (6.4%, a difference of 0.050%), Mexican (6.4%, a difference of 0.15%), Panamanian (6.4%, a difference of 0.31%), and Slavic (6.4%, a difference of 0.34%).
| Demographics | Rating | Rank | Ambulatory Disability |
| Hungarians | 9.6 /100 | #221 | Tragic 6.3% |
| German Russians | 9.4 /100 | #222 | Tragic 6.3% |
| Immigrants | Honduras | 7.6 /100 | #223 | Tragic 6.3% |
| Liberians | 7.1 /100 | #224 | Tragic 6.3% |
| Hondurans | 6.3 /100 | #225 | Tragic 6.3% |
| Slavs | 5.1 /100 | #226 | Tragic 6.4% |
| Cubans | 4.0 /100 | #227 | Tragic 6.4% |
| Portuguese | 4.0 /100 | #228 | Tragic 6.4% |
| Czechoslovakians | 3.8 /100 | #229 | Tragic 6.4% |
| Mexicans | 3.5 /100 | #230 | Tragic 6.4% |
| Panamanians | 3.1 /100 | #231 | Tragic 6.4% |
| Assyrians/Chaldeans/Syriacs | 2.4 /100 | #232 | Tragic 6.4% |
| Sub-Saharan Africans | 2.3 /100 | #233 | Tragic 6.4% |
| Immigrants | Liberia | 2.3 /100 | #234 | Tragic 6.4% |
| Hispanics or Latinos | 2.2 /100 | #235 | Tragic 6.4% |