Immigrants from Ecuador vs Maltese Ambulatory Disability
COMPARE
Immigrants from Ecuador
Maltese
Ambulatory Disability
Ambulatory Disability Comparison
Immigrants from Ecuador
Maltese
6.1%
AMBULATORY DISABILITY
53.8/ 100
METRIC RATING
170th/ 347
METRIC RANK
6.0%
AMBULATORY DISABILITY
81.6/ 100
METRIC RATING
150th/ 347
METRIC RANK
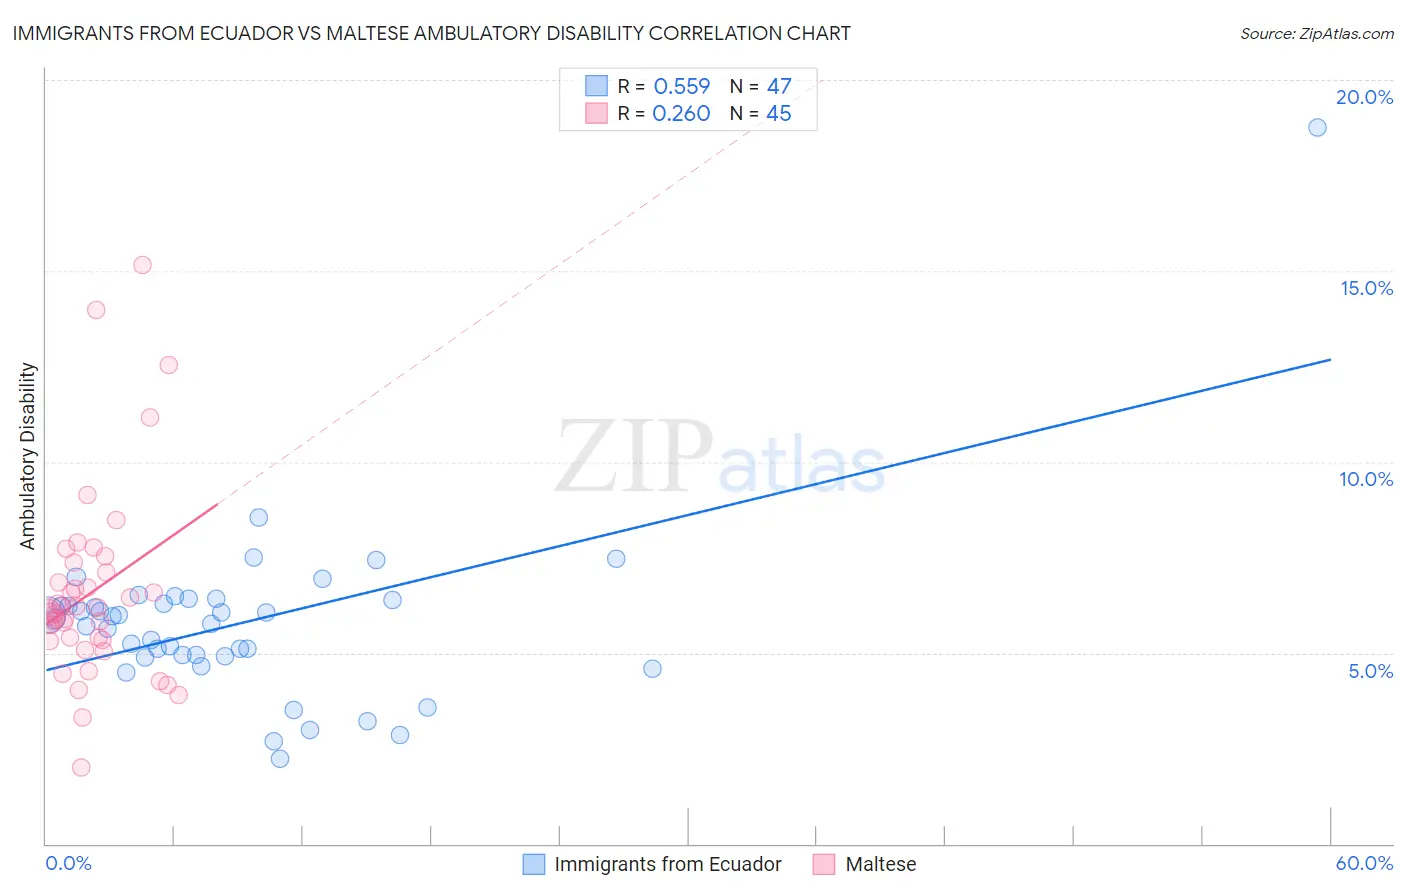
Immigrants from Ecuador vs Maltese Ambulatory Disability Correlation Chart
The statistical analysis conducted on geographies consisting of 270,935,255 people shows a substantial positive correlation between the proportion of Immigrants from Ecuador and percentage of population with ambulatory disability in the United States with a correlation coefficient (R) of 0.559 and weighted average of 6.1%. Similarly, the statistical analysis conducted on geographies consisting of 126,465,300 people shows a weak positive correlation between the proportion of Maltese and percentage of population with ambulatory disability in the United States with a correlation coefficient (R) of 0.260 and weighted average of 6.0%, a difference of 1.8%.
Ambulatory Disability Correlation Summary
| Measurement | Immigrants from Ecuador | Maltese |
| Minimum | 2.2% | 2.0% |
| Maximum | 18.8% | 15.2% |
| Range | 16.5% | 13.2% |
| Mean | 5.8% | 6.6% |
| Median | 5.9% | 6.1% |
| Interquartile 25% (IQ1) | 4.9% | 5.3% |
| Interquartile 75% (IQ3) | 6.4% | 7.2% |
| Interquartile Range (IQR) | 1.5% | 1.9% |
| Standard Deviation (Sample) | 2.4% | 2.5% |
| Standard Deviation (Population) | 2.3% | 2.5% |
Demographics Similar to Immigrants from Ecuador and Maltese by Ambulatory Disability
In terms of ambulatory disability, the demographic groups most similar to Immigrants from Ecuador are Immigrants from Southern Europe (6.1%, a difference of 0.23%), Ecuadorian (6.1%, a difference of 0.36%), Immigrants from Oceania (6.1%, a difference of 0.38%), Iraqi (6.1%, a difference of 0.49%), and Nicaraguan (6.1%, a difference of 0.52%). Similarly, the demographic groups most similar to Maltese are Greek (6.0%, a difference of 0.18%), Immigrants from Austria (6.0%, a difference of 0.25%), Syrian (6.0%, a difference of 0.50%), Immigrants from Croatia (6.0%, a difference of 0.52%), and Immigrants from Scotland (6.0%, a difference of 0.73%).
| Demographics | Rating | Rank | Ambulatory Disability |
| Maltese | 81.6 /100 | #150 | Excellent 6.0% |
| Greeks | 79.6 /100 | #151 | Good 6.0% |
| Immigrants | Austria | 78.8 /100 | #152 | Good 6.0% |
| Syrians | 75.5 /100 | #153 | Good 6.0% |
| Immigrants | Croatia | 75.1 /100 | #154 | Good 6.0% |
| Immigrants | Scotland | 72.1 /100 | #155 | Good 6.0% |
| Northern Europeans | 71.8 /100 | #156 | Good 6.0% |
| Ghanaians | 71.3 /100 | #157 | Good 6.0% |
| Immigrants | Fiji | 71.2 /100 | #158 | Good 6.0% |
| Immigrants | Latvia | 71.1 /100 | #159 | Good 6.0% |
| Central Americans | 69.8 /100 | #160 | Good 6.0% |
| Immigrants | Belarus | 69.2 /100 | #161 | Good 6.1% |
| Nigerians | 67.1 /100 | #162 | Good 6.1% |
| Lebanese | 66.2 /100 | #163 | Good 6.1% |
| Basques | 63.7 /100 | #164 | Good 6.1% |
| Nicaraguans | 63.2 /100 | #165 | Good 6.1% |
| Iraqis | 62.8 /100 | #166 | Good 6.1% |
| Immigrants | Oceania | 60.7 /100 | #167 | Good 6.1% |
| Ecuadorians | 60.5 /100 | #168 | Good 6.1% |
| Immigrants | Southern Europe | 58.1 /100 | #169 | Average 6.1% |
| Immigrants | Ecuador | 53.8 /100 | #170 | Average 6.1% |