Immigrants from Ecuador vs Central American 9th Grade
COMPARE
Immigrants from Ecuador
Central American
9th Grade
9th Grade Comparison
Immigrants from Ecuador
Central Americans
91.8%
9TH GRADE
0.0/ 100
METRIC RATING
321st/ 347
METRIC RANK
90.4%
9TH GRADE
0.0/ 100
METRIC RATING
338th/ 347
METRIC RANK
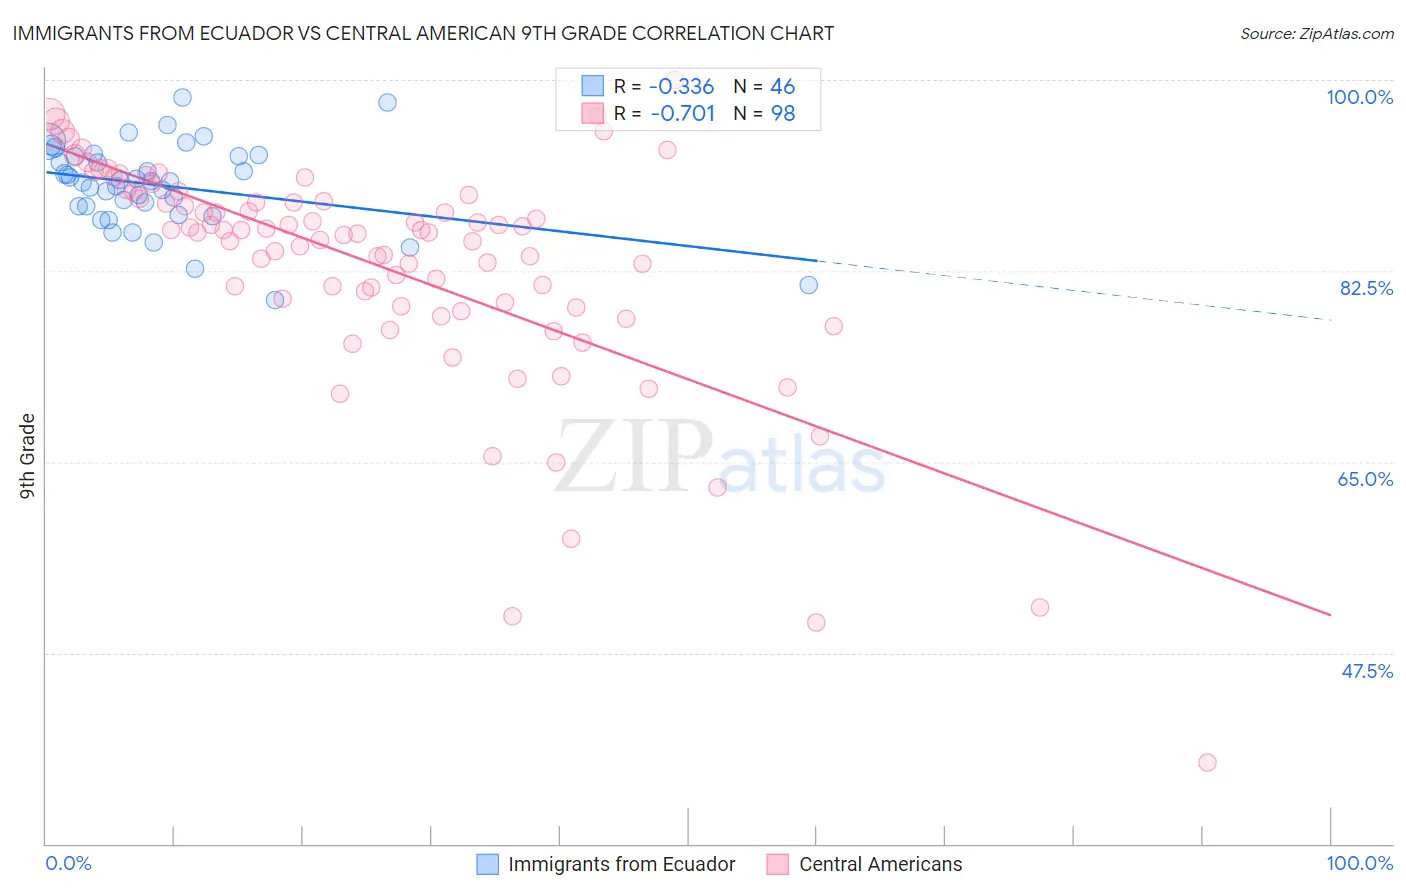
Immigrants from Ecuador vs Central American 9th Grade Correlation Chart
The statistical analysis conducted on geographies consisting of 270,907,929 people shows a mild negative correlation between the proportion of Immigrants from Ecuador and percentage of population with at least 9th grade education in the United States with a correlation coefficient (R) of -0.336 and weighted average of 91.8%. Similarly, the statistical analysis conducted on geographies consisting of 504,619,198 people shows a strong negative correlation between the proportion of Central Americans and percentage of population with at least 9th grade education in the United States with a correlation coefficient (R) of -0.701 and weighted average of 90.4%, a difference of 1.7%.
9th Grade Correlation Summary
| Measurement | Immigrants from Ecuador | Central American |
| Minimum | 79.8% | 37.5% |
| Maximum | 98.4% | 100.0% |
| Range | 18.6% | 62.5% |
| Mean | 90.3% | 82.9% |
| Median | 90.7% | 86.0% |
| Interquartile 25% (IQ1) | 88.4% | 79.3% |
| Interquartile 75% (IQ3) | 93.0% | 89.2% |
| Interquartile Range (IQR) | 4.6% | 9.9% |
| Standard Deviation (Sample) | 3.9% | 10.7% |
| Standard Deviation (Population) | 3.9% | 10.7% |
Demographics Similar to Immigrants from Ecuador and Central Americans by 9th Grade
In terms of 9th grade, the demographic groups most similar to Immigrants from Ecuador are Belizean (91.8%, a difference of 0.030%), Puerto Rican (91.8%, a difference of 0.030%), Nicaraguan (91.9%, a difference of 0.070%), Immigrants from Belize (91.8%, a difference of 0.090%), and Ecuadorian (91.9%, a difference of 0.11%). Similarly, the demographic groups most similar to Central Americans are Immigrants from Latin America (90.4%, a difference of 0.010%), Immigrants from Dominican Republic (90.5%, a difference of 0.13%), Immigrants from Honduras (90.6%, a difference of 0.26%), Yakama (90.1%, a difference of 0.34%), and Immigrants from the Azores (90.8%, a difference of 0.44%).
| Demographics | Rating | Rank | 9th Grade |
| Ecuadorians | 0.0 /100 | #319 | Tragic 91.9% |
| Nicaraguans | 0.0 /100 | #320 | Tragic 91.9% |
| Immigrants | Ecuador | 0.0 /100 | #321 | Tragic 91.8% |
| Belizeans | 0.0 /100 | #322 | Tragic 91.8% |
| Puerto Ricans | 0.0 /100 | #323 | Tragic 91.8% |
| Immigrants | Belize | 0.0 /100 | #324 | Tragic 91.8% |
| Central American Indians | 0.0 /100 | #325 | Tragic 91.5% |
| Immigrants | Armenia | 0.0 /100 | #326 | Tragic 91.4% |
| Immigrants | Nicaragua | 0.0 /100 | #327 | Tragic 91.3% |
| Dominicans | 0.0 /100 | #328 | Tragic 91.1% |
| Hondurans | 0.0 /100 | #329 | Tragic 91.0% |
| Immigrants | Cabo Verde | 0.0 /100 | #330 | Tragic 90.9% |
| Mexican American Indians | 0.0 /100 | #331 | Tragic 90.9% |
| Hispanics or Latinos | 0.0 /100 | #332 | Tragic 90.9% |
| Immigrants | Yemen | 0.0 /100 | #333 | Tragic 90.8% |
| Immigrants | Azores | 0.0 /100 | #334 | Tragic 90.8% |
| Immigrants | Honduras | 0.0 /100 | #335 | Tragic 90.6% |
| Immigrants | Dominican Republic | 0.0 /100 | #336 | Tragic 90.5% |
| Immigrants | Latin America | 0.0 /100 | #337 | Tragic 90.4% |
| Central Americans | 0.0 /100 | #338 | Tragic 90.4% |
| Yakama | 0.0 /100 | #339 | Tragic 90.1% |