Immigrants from Eastern Europe vs Tongan Associate's Degree
COMPARE
Immigrants from Eastern Europe
Tongan
Associate's Degree
Associate's Degree Comparison
Immigrants from Eastern Europe
Tongans
50.5%
ASSOCIATE'S DEGREE
99.1/ 100
METRIC RATING
78th/ 347
METRIC RANK
43.0%
ASSOCIATE'S DEGREE
2.2/ 100
METRIC RATING
233rd/ 347
METRIC RANK
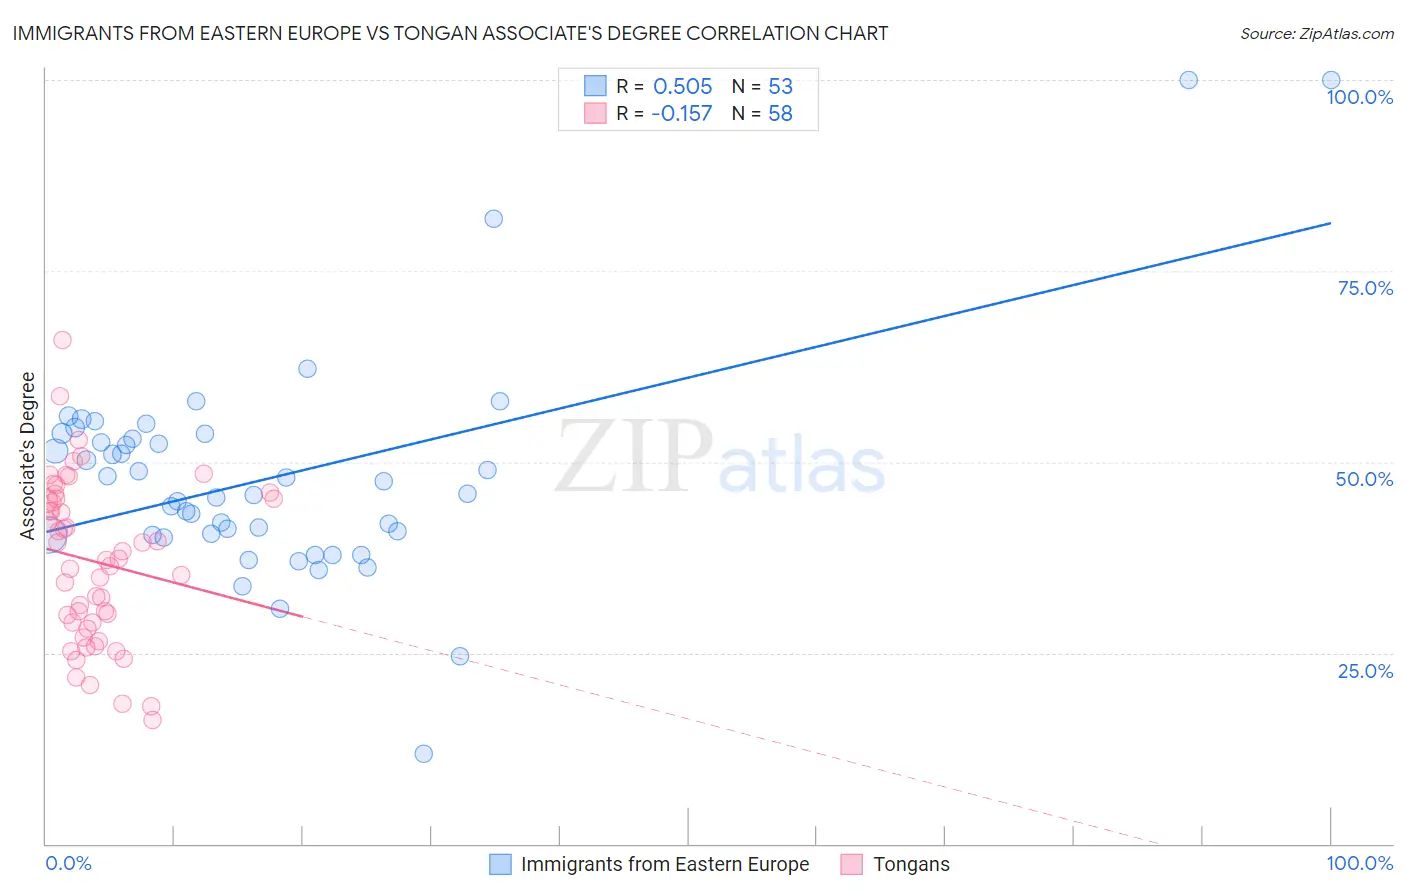
Immigrants from Eastern Europe vs Tongan Associate's Degree Correlation Chart
The statistical analysis conducted on geographies consisting of 475,831,649 people shows a substantial positive correlation between the proportion of Immigrants from Eastern Europe and percentage of population with at least associate's degree education in the United States with a correlation coefficient (R) of 0.505 and weighted average of 50.5%. Similarly, the statistical analysis conducted on geographies consisting of 102,908,759 people shows a poor negative correlation between the proportion of Tongans and percentage of population with at least associate's degree education in the United States with a correlation coefficient (R) of -0.157 and weighted average of 43.0%, a difference of 17.2%.
Associate's Degree Correlation Summary
| Measurement | Immigrants from Eastern Europe | Tongan |
| Minimum | 11.8% | 16.2% |
| Maximum | 100.0% | 65.9% |
| Range | 88.2% | 49.7% |
| Mean | 47.9% | 37.0% |
| Median | 45.8% | 37.2% |
| Interquartile 25% (IQ1) | 40.4% | 28.9% |
| Interquartile 75% (IQ3) | 53.3% | 45.1% |
| Interquartile Range (IQR) | 12.9% | 16.2% |
| Standard Deviation (Sample) | 14.6% | 10.6% |
| Standard Deviation (Population) | 14.5% | 10.5% |
Similar Demographics by Associate's Degree
Demographics Similar to Immigrants from Eastern Europe by Associate's Degree
In terms of associate's degree, the demographic groups most similar to Immigrants from Eastern Europe are Ethiopian (50.4%, a difference of 0.010%), Immigrants from Lebanon (50.5%, a difference of 0.040%), Armenian (50.4%, a difference of 0.050%), Immigrants from Zimbabwe (50.5%, a difference of 0.080%), and Maltese (50.4%, a difference of 0.12%).
| Demographics | Rating | Rank | Associate's Degree |
| Immigrants | Romania | 99.5 /100 | #71 | Exceptional 50.9% |
| Immigrants | Pakistan | 99.5 /100 | #72 | Exceptional 50.9% |
| Carpatho Rusyns | 99.3 /100 | #73 | Exceptional 50.6% |
| Lithuanians | 99.3 /100 | #74 | Exceptional 50.6% |
| Immigrants | Scotland | 99.3 /100 | #75 | Exceptional 50.6% |
| Immigrants | Zimbabwe | 99.2 /100 | #76 | Exceptional 50.5% |
| Immigrants | Lebanon | 99.1 /100 | #77 | Exceptional 50.5% |
| Immigrants | Eastern Europe | 99.1 /100 | #78 | Exceptional 50.5% |
| Ethiopians | 99.1 /100 | #79 | Exceptional 50.4% |
| Armenians | 99.1 /100 | #80 | Exceptional 50.4% |
| Maltese | 99.1 /100 | #81 | Exceptional 50.4% |
| Greeks | 98.9 /100 | #82 | Exceptional 50.3% |
| Immigrants | Uzbekistan | 98.9 /100 | #83 | Exceptional 50.3% |
| Immigrants | Hungary | 98.9 /100 | #84 | Exceptional 50.2% |
| Immigrants | Egypt | 98.9 /100 | #85 | Exceptional 50.2% |
Demographics Similar to Tongans by Associate's Degree
In terms of associate's degree, the demographic groups most similar to Tongans are Tlingit-Haida (43.0%, a difference of 0.090%), Native Hawaiian (43.1%, a difference of 0.16%), Ecuadorian (43.0%, a difference of 0.19%), Immigrants from St. Vincent and the Grenadines (42.9%, a difference of 0.27%), and Nonimmigrants (42.9%, a difference of 0.29%).
| Demographics | Rating | Rank | Associate's Degree |
| Immigrants | Burma/Myanmar | 4.3 /100 | #226 | Tragic 43.7% |
| Trinidadians and Tobagonians | 4.0 /100 | #227 | Tragic 43.6% |
| Hmong | 3.2 /100 | #228 | Tragic 43.4% |
| Immigrants | Trinidad and Tobago | 3.0 /100 | #229 | Tragic 43.3% |
| Immigrants | Barbados | 2.9 /100 | #230 | Tragic 43.3% |
| Liberians | 2.9 /100 | #231 | Tragic 43.3% |
| Native Hawaiians | 2.3 /100 | #232 | Tragic 43.1% |
| Tongans | 2.2 /100 | #233 | Tragic 43.0% |
| Tlingit-Haida | 2.1 /100 | #234 | Tragic 43.0% |
| Ecuadorians | 2.0 /100 | #235 | Tragic 43.0% |
| Immigrants | St. Vincent and the Grenadines | 1.9 /100 | #236 | Tragic 42.9% |
| Immigrants | Nonimmigrants | 1.9 /100 | #237 | Tragic 42.9% |
| Iroquois | 1.7 /100 | #238 | Tragic 42.8% |
| Immigrants | Grenada | 1.3 /100 | #239 | Tragic 42.6% |
| Cree | 1.2 /100 | #240 | Tragic 42.5% |