Immigrants from Eastern Europe vs Menominee Bachelor's Degree
COMPARE
Immigrants from Eastern Europe
Menominee
Bachelor's Degree
Bachelor's Degree Comparison
Immigrants from Eastern Europe
Menominee
42.5%
BACHELOR'S DEGREE
99.4/ 100
METRIC RATING
77th/ 347
METRIC RANK
27.3%
BACHELOR'S DEGREE
0.0/ 100
METRIC RATING
332nd/ 347
METRIC RANK
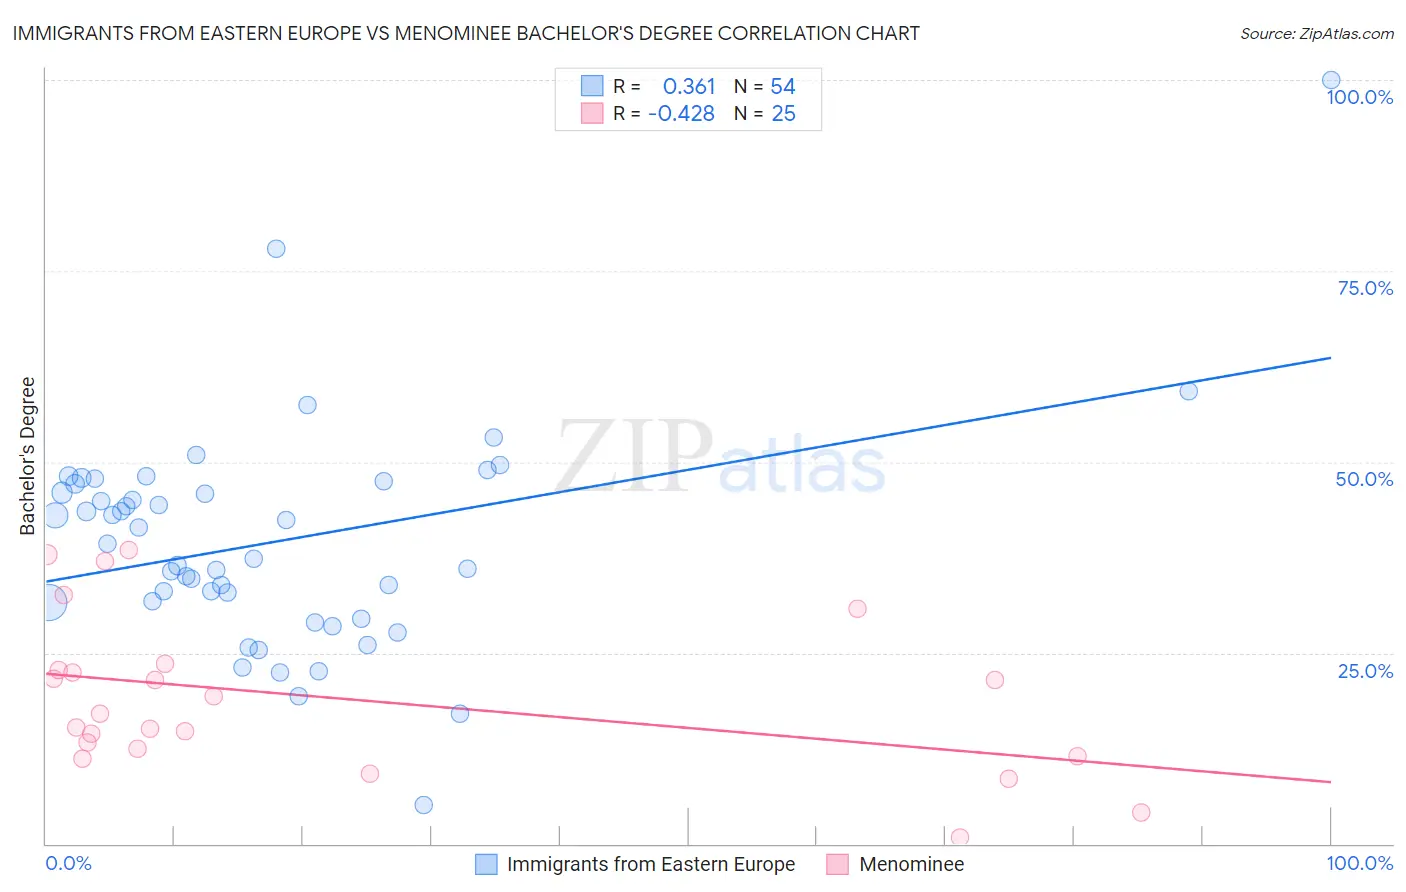
Immigrants from Eastern Europe vs Menominee Bachelor's Degree Correlation Chart
The statistical analysis conducted on geographies consisting of 475,819,217 people shows a mild positive correlation between the proportion of Immigrants from Eastern Europe and percentage of population with at least bachelor's degree education in the United States with a correlation coefficient (R) of 0.361 and weighted average of 42.5%. Similarly, the statistical analysis conducted on geographies consisting of 45,778,829 people shows a moderate negative correlation between the proportion of Menominee and percentage of population with at least bachelor's degree education in the United States with a correlation coefficient (R) of -0.428 and weighted average of 27.3%, a difference of 55.7%.
Bachelor's Degree Correlation Summary
| Measurement | Immigrants from Eastern Europe | Menominee |
| Minimum | 5.0% | 0.82% |
| Maximum | 100.0% | 38.4% |
| Range | 95.0% | 37.6% |
| Mean | 39.5% | 19.1% |
| Median | 38.3% | 17.1% |
| Interquartile 25% (IQ1) | 31.6% | 12.0% |
| Interquartile 75% (IQ3) | 47.1% | 23.1% |
| Interquartile Range (IQR) | 15.5% | 11.2% |
| Standard Deviation (Sample) | 14.7% | 10.1% |
| Standard Deviation (Population) | 14.5% | 9.9% |
Similar Demographics by Bachelor's Degree
Demographics Similar to Immigrants from Eastern Europe by Bachelor's Degree
In terms of bachelor's degree, the demographic groups most similar to Immigrants from Eastern Europe are Immigrants from Ethiopia (42.5%, a difference of 0.060%), Immigrants from Egypt (42.6%, a difference of 0.18%), Immigrants from Zimbabwe (42.6%, a difference of 0.20%), Immigrants from Lebanon (42.4%, a difference of 0.23%), and Bhutanese (42.7%, a difference of 0.41%).
| Demographics | Rating | Rank | Bachelor's Degree |
| Immigrants | Romania | 99.6 /100 | #70 | Exceptional 42.9% |
| Immigrants | Argentina | 99.6 /100 | #71 | Exceptional 42.8% |
| Ethiopians | 99.5 /100 | #72 | Exceptional 42.8% |
| Immigrants | Uzbekistan | 99.5 /100 | #73 | Exceptional 42.8% |
| Bhutanese | 99.5 /100 | #74 | Exceptional 42.7% |
| Immigrants | Zimbabwe | 99.4 /100 | #75 | Exceptional 42.6% |
| Immigrants | Egypt | 99.4 /100 | #76 | Exceptional 42.6% |
| Immigrants | Eastern Europe | 99.4 /100 | #77 | Exceptional 42.5% |
| Immigrants | Ethiopia | 99.4 /100 | #78 | Exceptional 42.5% |
| Immigrants | Lebanon | 99.3 /100 | #79 | Exceptional 42.4% |
| Immigrants | Croatia | 99.2 /100 | #80 | Exceptional 42.3% |
| Immigrants | Hungary | 99.2 /100 | #81 | Exceptional 42.3% |
| Immigrants | Scotland | 99.2 /100 | #82 | Exceptional 42.3% |
| Armenians | 99.2 /100 | #83 | Exceptional 42.3% |
| Immigrants | Western Asia | 99.2 /100 | #84 | Exceptional 42.3% |
Demographics Similar to Menominee by Bachelor's Degree
In terms of bachelor's degree, the demographic groups most similar to Menominee are Immigrants from the Azores (27.3%, a difference of 0.10%), Spanish American Indian (27.5%, a difference of 0.58%), Immigrants from Central America (27.5%, a difference of 0.64%), Mexican (27.1%, a difference of 0.82%), and Crow (27.7%, a difference of 1.7%).
| Demographics | Rating | Rank | Bachelor's Degree |
| Pennsylvania Germans | 0.0 /100 | #325 | Tragic 28.4% |
| Apache | 0.0 /100 | #326 | Tragic 28.3% |
| Paiute | 0.0 /100 | #327 | Tragic 28.1% |
| Crow | 0.0 /100 | #328 | Tragic 27.7% |
| Immigrants | Central America | 0.0 /100 | #329 | Tragic 27.5% |
| Spanish American Indians | 0.0 /100 | #330 | Tragic 27.5% |
| Immigrants | Azores | 0.0 /100 | #331 | Tragic 27.3% |
| Menominee | 0.0 /100 | #332 | Tragic 27.3% |
| Mexicans | 0.0 /100 | #333 | Tragic 27.1% |
| Arapaho | 0.0 /100 | #334 | Tragic 26.6% |
| Natives/Alaskans | 0.0 /100 | #335 | Tragic 26.3% |
| Immigrants | Mexico | 0.0 /100 | #336 | Tragic 26.1% |
| Inupiat | 0.0 /100 | #337 | Tragic 25.8% |
| Pueblo | 0.0 /100 | #338 | Tragic 25.5% |
| Hopi | 0.0 /100 | #339 | Tragic 25.3% |