Immigrants from Eastern Asia vs Immigrants from Grenada Disability Age 5 to 17
COMPARE
Immigrants from Eastern Asia
Immigrants from Grenada
Disability Age 5 to 17
Disability Age 5 to 17 Comparison
Immigrants from Eastern Asia
Immigrants from Grenada
4.6%
DISABILITY AGE 5 TO 17
100.0/ 100
METRIC RATING
9th/ 347
METRIC RANK
5.3%
DISABILITY AGE 5 TO 17
99.1/ 100
METRIC RATING
95th/ 347
METRIC RANK
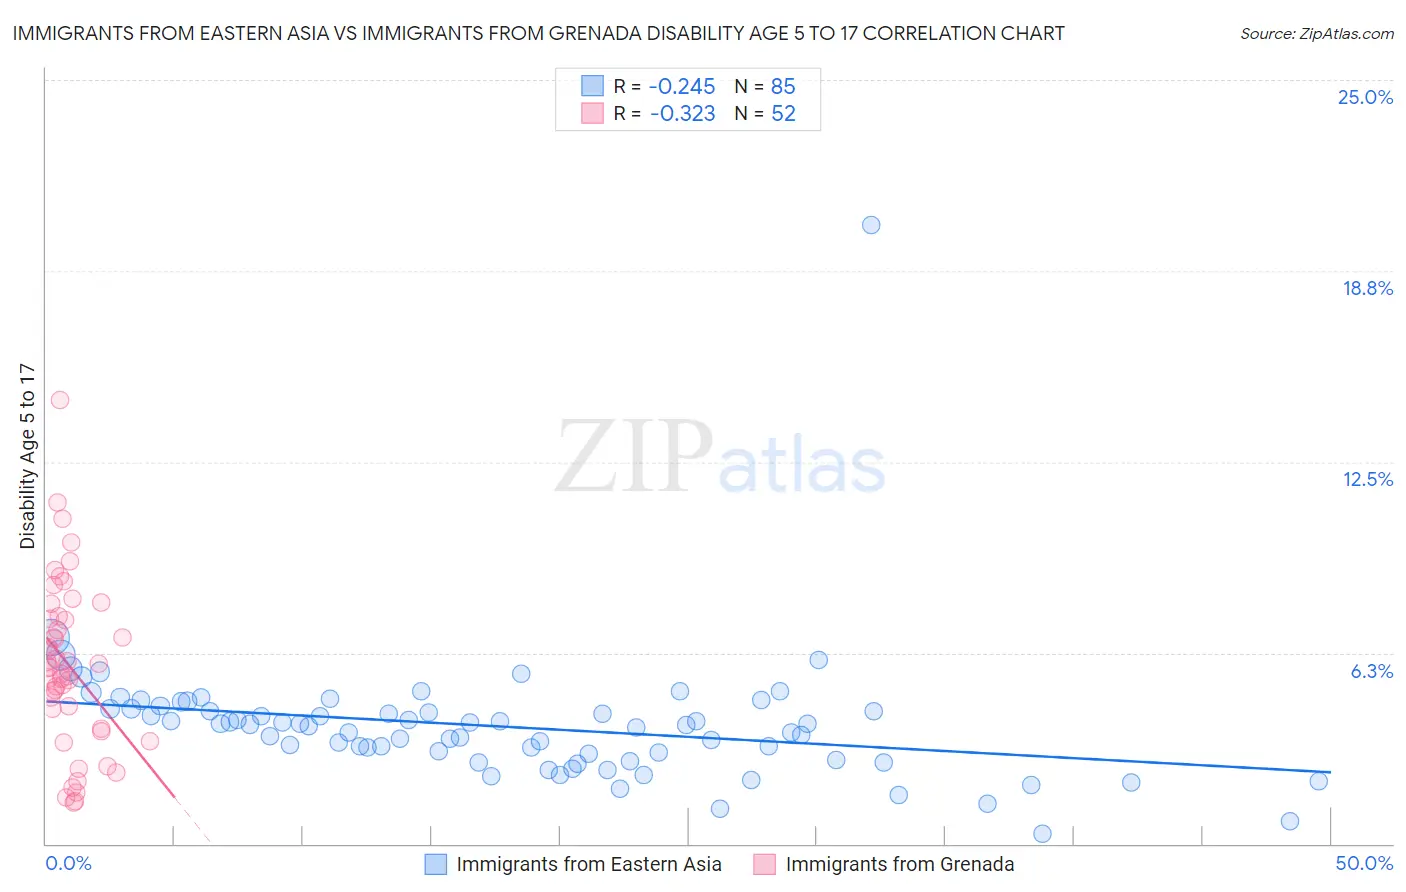
Immigrants from Eastern Asia vs Immigrants from Grenada Disability Age 5 to 17 Correlation Chart
The statistical analysis conducted on geographies consisting of 493,323,478 people shows a weak negative correlation between the proportion of Immigrants from Eastern Asia and percentage of population with a disability between the ages 5 and 17 in the United States with a correlation coefficient (R) of -0.245 and weighted average of 4.6%. Similarly, the statistical analysis conducted on geographies consisting of 67,127,267 people shows a mild negative correlation between the proportion of Immigrants from Grenada and percentage of population with a disability between the ages 5 and 17 in the United States with a correlation coefficient (R) of -0.323 and weighted average of 5.3%, a difference of 15.1%.
Disability Age 5 to 17 Correlation Summary
| Measurement | Immigrants from Eastern Asia | Immigrants from Grenada |
| Minimum | 0.35% | 1.4% |
| Maximum | 20.3% | 14.5% |
| Range | 19.9% | 13.2% |
| Mean | 3.8% | 5.9% |
| Median | 3.9% | 5.8% |
| Interquartile 25% (IQ1) | 2.8% | 4.1% |
| Interquartile 75% (IQ3) | 4.4% | 7.4% |
| Interquartile Range (IQR) | 1.6% | 3.3% |
| Standard Deviation (Sample) | 2.2% | 2.7% |
| Standard Deviation (Population) | 2.2% | 2.7% |
Similar Demographics by Disability Age 5 to 17
Demographics Similar to Immigrants from Eastern Asia by Disability Age 5 to 17
In terms of disability age 5 to 17, the demographic groups most similar to Immigrants from Eastern Asia are Immigrants from India (4.6%, a difference of 0.070%), Armenian (4.6%, a difference of 0.23%), Indian (Asian) (4.6%, a difference of 0.33%), Iranian (4.6%, a difference of 0.47%), and Immigrants from China (4.5%, a difference of 1.3%).
| Demographics | Rating | Rank | Disability Age 5 to 17 |
| Immigrants | Taiwan | 100.0 /100 | #2 | Exceptional 4.2% |
| Immigrants | Hong Kong | 100.0 /100 | #3 | Exceptional 4.3% |
| Filipinos | 100.0 /100 | #4 | Exceptional 4.3% |
| Immigrants | Iran | 100.0 /100 | #5 | Exceptional 4.4% |
| Immigrants | Israel | 100.0 /100 | #6 | Exceptional 4.5% |
| Immigrants | China | 100.0 /100 | #7 | Exceptional 4.5% |
| Indians (Asian) | 100.0 /100 | #8 | Exceptional 4.6% |
| Immigrants | Eastern Asia | 100.0 /100 | #9 | Exceptional 4.6% |
| Immigrants | India | 100.0 /100 | #10 | Exceptional 4.6% |
| Armenians | 100.0 /100 | #11 | Exceptional 4.6% |
| Iranians | 100.0 /100 | #12 | Exceptional 4.6% |
| Thais | 100.0 /100 | #13 | Exceptional 4.7% |
| Immigrants | Korea | 100.0 /100 | #14 | Exceptional 4.7% |
| Chinese | 100.0 /100 | #15 | Exceptional 4.7% |
| Immigrants | Singapore | 100.0 /100 | #16 | Exceptional 4.7% |
Demographics Similar to Immigrants from Grenada by Disability Age 5 to 17
In terms of disability age 5 to 17, the demographic groups most similar to Immigrants from Grenada are Immigrants from Jordan (5.3%, a difference of 0.020%), Immigrants from Peru (5.3%, a difference of 0.090%), Luxembourger (5.3%, a difference of 0.16%), Immigrants from El Salvador (5.3%, a difference of 0.16%), and Immigrants from Europe (5.3%, a difference of 0.16%).
| Demographics | Rating | Rank | Disability Age 5 to 17 |
| Immigrants | Croatia | 99.4 /100 | #88 | Exceptional 5.2% |
| Immigrants | Spain | 99.4 /100 | #89 | Exceptional 5.2% |
| Immigrants | Kuwait | 99.4 /100 | #90 | Exceptional 5.3% |
| Mongolians | 99.2 /100 | #91 | Exceptional 5.3% |
| Luxembourgers | 99.2 /100 | #92 | Exceptional 5.3% |
| Immigrants | Peru | 99.1 /100 | #93 | Exceptional 5.3% |
| Immigrants | Jordan | 99.1 /100 | #94 | Exceptional 5.3% |
| Immigrants | Grenada | 99.1 /100 | #95 | Exceptional 5.3% |
| Immigrants | El Salvador | 99.0 /100 | #96 | Exceptional 5.3% |
| Immigrants | Europe | 99.0 /100 | #97 | Exceptional 5.3% |
| Immigrants | Austria | 98.9 /100 | #98 | Exceptional 5.3% |
| Cambodians | 98.8 /100 | #99 | Exceptional 5.3% |
| Nepalese | 98.7 /100 | #100 | Exceptional 5.3% |
| Menominee | 98.7 /100 | #101 | Exceptional 5.3% |
| Nicaraguans | 98.6 /100 | #102 | Exceptional 5.3% |