Ute vs Immigrants from Canada Disability
COMPARE
Ute
Immigrants from Canada
Disability
Disability Comparison
Ute
Immigrants from Canada
11.9%
DISABILITY
19.5/ 100
METRIC RATING
191st/ 347
METRIC RANK
12.1%
DISABILITY
6.1/ 100
METRIC RATING
215th/ 347
METRIC RANK
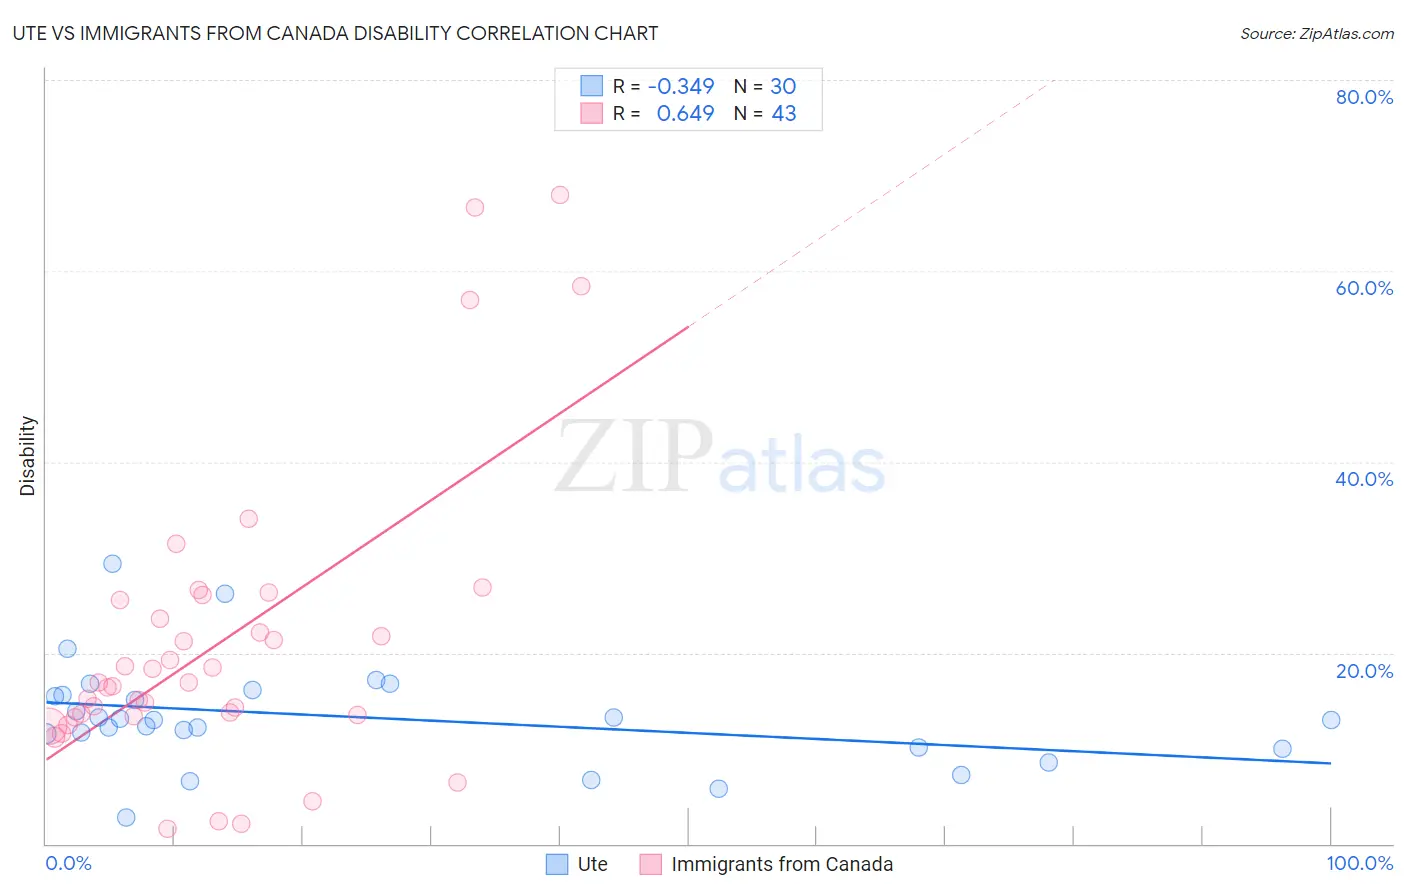
Ute vs Immigrants from Canada Disability Correlation Chart
The statistical analysis conducted on geographies consisting of 55,668,381 people shows a mild negative correlation between the proportion of Ute and percentage of population with a disability in the United States with a correlation coefficient (R) of -0.349 and weighted average of 11.9%. Similarly, the statistical analysis conducted on geographies consisting of 459,374,446 people shows a significant positive correlation between the proportion of Immigrants from Canada and percentage of population with a disability in the United States with a correlation coefficient (R) of 0.649 and weighted average of 12.1%, a difference of 1.4%.
Disability Correlation Summary
| Measurement | Ute | Immigrants from Canada |
| Minimum | 2.8% | 1.6% |
| Maximum | 29.3% | 68.0% |
| Range | 26.5% | 66.4% |
| Mean | 13.3% | 21.0% |
| Median | 12.9% | 16.9% |
| Interquartile 25% (IQ1) | 10.1% | 13.3% |
| Interquartile 75% (IQ3) | 15.6% | 25.6% |
| Interquartile Range (IQR) | 5.5% | 12.2% |
| Standard Deviation (Sample) | 5.5% | 15.3% |
| Standard Deviation (Population) | 5.4% | 15.2% |
Similar Demographics by Disability
Demographics Similar to Ute by Disability
In terms of disability, the demographic groups most similar to Ute are Lithuanian (11.9%, a difference of 0.050%), Immigrants from Bosnia and Herzegovina (11.9%, a difference of 0.10%), Immigrants from West Indies (11.9%, a difference of 0.11%), Immigrants from Zaire (11.9%, a difference of 0.16%), and Somali (11.9%, a difference of 0.16%).
| Demographics | Rating | Rank | Disability |
| Iraqis | 30.0 /100 | #184 | Fair 11.8% |
| Immigrants | Burma/Myanmar | 28.5 /100 | #185 | Fair 11.8% |
| Immigrants | Scotland | 28.2 /100 | #186 | Fair 11.8% |
| Lebanese | 27.9 /100 | #187 | Fair 11.8% |
| Immigrants | Mexico | 23.8 /100 | #188 | Fair 11.9% |
| Immigrants | Zaire | 21.8 /100 | #189 | Fair 11.9% |
| Immigrants | West Indies | 21.1 /100 | #190 | Fair 11.9% |
| Ute | 19.5 /100 | #191 | Poor 11.9% |
| Lithuanians | 18.8 /100 | #192 | Poor 11.9% |
| Immigrants | Bosnia and Herzegovina | 18.0 /100 | #193 | Poor 11.9% |
| Somalis | 17.3 /100 | #194 | Poor 11.9% |
| Barbadians | 15.8 /100 | #195 | Poor 11.9% |
| Serbians | 15.4 /100 | #196 | Poor 11.9% |
| Immigrants | Belize | 15.2 /100 | #197 | Poor 11.9% |
| Ukrainians | 14.7 /100 | #198 | Poor 11.9% |
Demographics Similar to Immigrants from Canada by Disability
In terms of disability, the demographic groups most similar to Immigrants from Canada are Immigrants from Somalia (12.0%, a difference of 0.13%), Panamanian (12.1%, a difference of 0.15%), Immigrants from North America (12.1%, a difference of 0.16%), Austrian (12.0%, a difference of 0.18%), and Immigrants from Iraq (12.0%, a difference of 0.18%).
| Demographics | Rating | Rank | Disability |
| Immigrants | Caribbean | 9.1 /100 | #208 | Tragic 12.0% |
| Danes | 8.7 /100 | #209 | Tragic 12.0% |
| Czechs | 7.9 /100 | #210 | Tragic 12.0% |
| Immigrants | Cambodia | 7.3 /100 | #211 | Tragic 12.0% |
| Austrians | 7.2 /100 | #212 | Tragic 12.0% |
| Immigrants | Iraq | 7.1 /100 | #213 | Tragic 12.0% |
| Immigrants | Somalia | 6.8 /100 | #214 | Tragic 12.0% |
| Immigrants | Canada | 6.1 /100 | #215 | Tragic 12.1% |
| Panamanians | 5.4 /100 | #216 | Tragic 12.1% |
| Immigrants | North America | 5.3 /100 | #217 | Tragic 12.1% |
| Immigrants | Jamaica | 5.0 /100 | #218 | Tragic 12.1% |
| Croatians | 4.9 /100 | #219 | Tragic 12.1% |
| Immigrants | Bahamas | 4.7 /100 | #220 | Tragic 12.1% |
| Northern Europeans | 4.2 /100 | #221 | Tragic 12.1% |
| Spanish American Indians | 4.1 /100 | #222 | Tragic 12.1% |