Immigrants from Northern Africa vs Immigrants from Canada Disability
COMPARE
Immigrants from Northern Africa
Immigrants from Canada
Disability
Disability Comparison
Immigrants from Northern Africa
Immigrants from Canada
10.9%
DISABILITY
99.7/ 100
METRIC RATING
62nd/ 347
METRIC RANK
12.1%
DISABILITY
6.1/ 100
METRIC RATING
215th/ 347
METRIC RANK
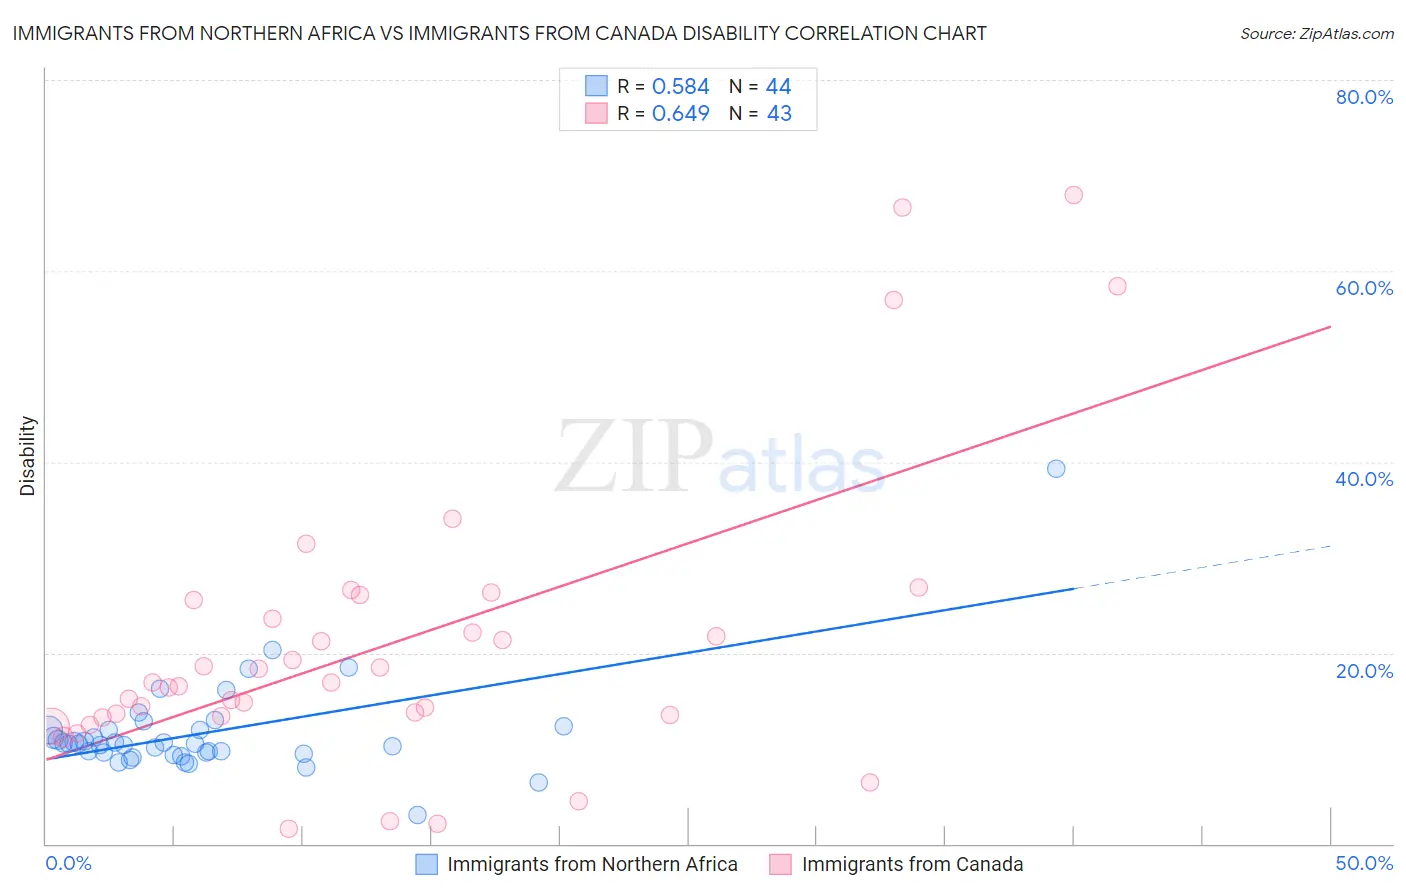
Immigrants from Northern Africa vs Immigrants from Canada Disability Correlation Chart
The statistical analysis conducted on geographies consisting of 321,190,304 people shows a substantial positive correlation between the proportion of Immigrants from Northern Africa and percentage of population with a disability in the United States with a correlation coefficient (R) of 0.584 and weighted average of 10.9%. Similarly, the statistical analysis conducted on geographies consisting of 459,374,446 people shows a significant positive correlation between the proportion of Immigrants from Canada and percentage of population with a disability in the United States with a correlation coefficient (R) of 0.649 and weighted average of 12.1%, a difference of 10.1%.
Disability Correlation Summary
| Measurement | Immigrants from Northern Africa | Immigrants from Canada |
| Minimum | 3.0% | 1.6% |
| Maximum | 39.3% | 68.0% |
| Range | 36.3% | 66.4% |
| Mean | 11.6% | 21.0% |
| Median | 10.5% | 16.9% |
| Interquartile 25% (IQ1) | 9.4% | 13.3% |
| Interquartile 75% (IQ3) | 11.9% | 25.6% |
| Interquartile Range (IQR) | 2.5% | 12.2% |
| Standard Deviation (Sample) | 5.3% | 15.3% |
| Standard Deviation (Population) | 5.2% | 15.2% |
Similar Demographics by Disability
Demographics Similar to Immigrants from Northern Africa by Disability
In terms of disability, the demographic groups most similar to Immigrants from Northern Africa are Immigrants from Eritrea (11.0%, a difference of 0.020%), Immigrants from Bulgaria (10.9%, a difference of 0.040%), Zimbabwean (10.9%, a difference of 0.10%), Immigrants from Colombia (10.9%, a difference of 0.19%), and Immigrants from Sweden (11.0%, a difference of 0.20%).
| Demographics | Rating | Rank | Disability |
| Immigrants | El Salvador | 99.8 /100 | #55 | Exceptional 10.9% |
| Immigrants | Lithuania | 99.8 /100 | #56 | Exceptional 10.9% |
| Salvadorans | 99.8 /100 | #57 | Exceptional 10.9% |
| Immigrants | South America | 99.8 /100 | #58 | Exceptional 10.9% |
| Immigrants | Colombia | 99.7 /100 | #59 | Exceptional 10.9% |
| Zimbabweans | 99.7 /100 | #60 | Exceptional 10.9% |
| Immigrants | Bulgaria | 99.7 /100 | #61 | Exceptional 10.9% |
| Immigrants | Northern Africa | 99.7 /100 | #62 | Exceptional 10.9% |
| Immigrants | Eritrea | 99.7 /100 | #63 | Exceptional 11.0% |
| Immigrants | Sweden | 99.6 /100 | #64 | Exceptional 11.0% |
| Bulgarians | 99.6 /100 | #65 | Exceptional 11.0% |
| Laotians | 99.6 /100 | #66 | Exceptional 11.0% |
| Colombians | 99.6 /100 | #67 | Exceptional 11.0% |
| Immigrants | Afghanistan | 99.6 /100 | #68 | Exceptional 11.0% |
| Sri Lankans | 99.5 /100 | #69 | Exceptional 11.0% |
Demographics Similar to Immigrants from Canada by Disability
In terms of disability, the demographic groups most similar to Immigrants from Canada are Immigrants from Somalia (12.0%, a difference of 0.13%), Panamanian (12.1%, a difference of 0.15%), Immigrants from North America (12.1%, a difference of 0.16%), Austrian (12.0%, a difference of 0.18%), and Immigrants from Iraq (12.0%, a difference of 0.18%).
| Demographics | Rating | Rank | Disability |
| Immigrants | Caribbean | 9.1 /100 | #208 | Tragic 12.0% |
| Danes | 8.7 /100 | #209 | Tragic 12.0% |
| Czechs | 7.9 /100 | #210 | Tragic 12.0% |
| Immigrants | Cambodia | 7.3 /100 | #211 | Tragic 12.0% |
| Austrians | 7.2 /100 | #212 | Tragic 12.0% |
| Immigrants | Iraq | 7.1 /100 | #213 | Tragic 12.0% |
| Immigrants | Somalia | 6.8 /100 | #214 | Tragic 12.0% |
| Immigrants | Canada | 6.1 /100 | #215 | Tragic 12.1% |
| Panamanians | 5.4 /100 | #216 | Tragic 12.1% |
| Immigrants | North America | 5.3 /100 | #217 | Tragic 12.1% |
| Immigrants | Jamaica | 5.0 /100 | #218 | Tragic 12.1% |
| Croatians | 4.9 /100 | #219 | Tragic 12.1% |
| Immigrants | Bahamas | 4.7 /100 | #220 | Tragic 12.1% |
| Northern Europeans | 4.2 /100 | #221 | Tragic 12.1% |
| Spanish American Indians | 4.1 /100 | #222 | Tragic 12.1% |