Immigrants from Eastern Africa vs Brazilian Hearing Disability
COMPARE
Immigrants from Eastern Africa
Brazilian
Hearing Disability
Hearing Disability Comparison
Immigrants from Eastern Africa
Brazilians
2.8%
HEARING DISABILITY
95.0/ 100
METRIC RATING
100th/ 347
METRIC RANK
2.9%
HEARING DISABILITY
78.7/ 100
METRIC RATING
146th/ 347
METRIC RANK
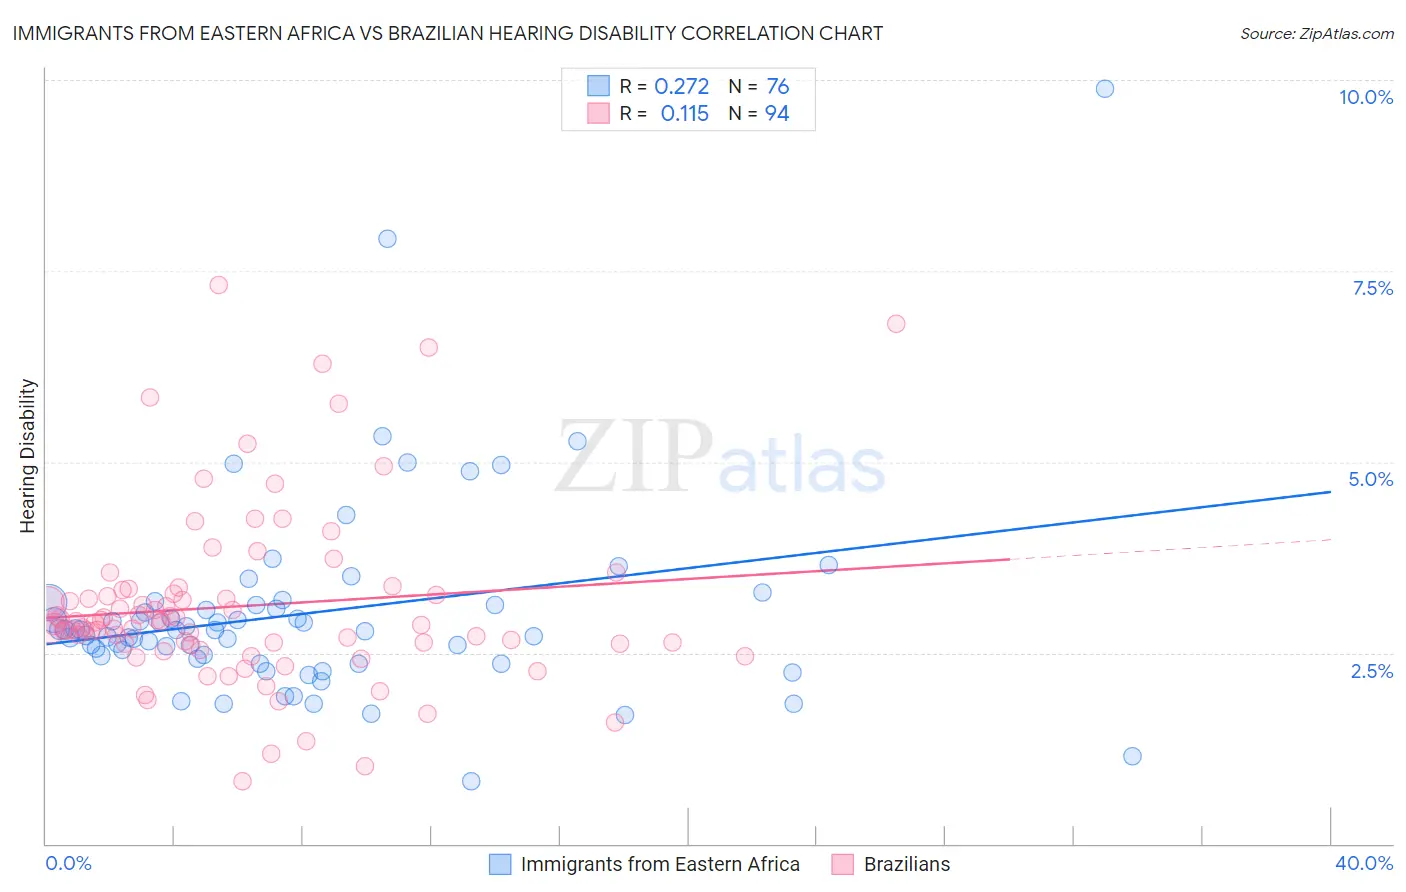
Immigrants from Eastern Africa vs Brazilian Hearing Disability Correlation Chart
The statistical analysis conducted on geographies consisting of 355,030,824 people shows a weak positive correlation between the proportion of Immigrants from Eastern Africa and percentage of population with hearing disability in the United States with a correlation coefficient (R) of 0.272 and weighted average of 2.8%. Similarly, the statistical analysis conducted on geographies consisting of 323,867,149 people shows a poor positive correlation between the proportion of Brazilians and percentage of population with hearing disability in the United States with a correlation coefficient (R) of 0.115 and weighted average of 2.9%, a difference of 4.1%.
Hearing Disability Correlation Summary
| Measurement | Immigrants from Eastern Africa | Brazilian |
| Minimum | 0.83% | 0.82% |
| Maximum | 9.9% | 7.3% |
| Range | 9.1% | 6.5% |
| Mean | 3.0% | 3.1% |
| Median | 2.8% | 2.9% |
| Interquartile 25% (IQ1) | 2.4% | 2.6% |
| Interquartile 75% (IQ3) | 3.1% | 3.3% |
| Interquartile Range (IQR) | 0.68% | 0.65% |
| Standard Deviation (Sample) | 1.3% | 1.2% |
| Standard Deviation (Population) | 1.3% | 1.2% |
Similar Demographics by Hearing Disability
Demographics Similar to Immigrants from Eastern Africa by Hearing Disability
In terms of hearing disability, the demographic groups most similar to Immigrants from Eastern Africa are Immigrants from Guatemala (2.8%, a difference of 0.050%), Immigrants from Spain (2.8%, a difference of 0.050%), Taiwanese (2.8%, a difference of 0.070%), Immigrants from Honduras (2.8%, a difference of 0.090%), and Immigrants from Indonesia (2.8%, a difference of 0.12%).
| Demographics | Rating | Rank | Hearing Disability |
| Immigrants | Kuwait | 96.3 /100 | #93 | Exceptional 2.8% |
| Uruguayans | 95.9 /100 | #94 | Exceptional 2.8% |
| Israelis | 95.9 /100 | #95 | Exceptional 2.8% |
| Immigrants | Somalia | 95.5 /100 | #96 | Exceptional 2.8% |
| Immigrants | Afghanistan | 95.3 /100 | #97 | Exceptional 2.8% |
| Immigrants | Honduras | 95.1 /100 | #98 | Exceptional 2.8% |
| Immigrants | Guatemala | 95.1 /100 | #99 | Exceptional 2.8% |
| Immigrants | Eastern Africa | 95.0 /100 | #100 | Exceptional 2.8% |
| Immigrants | Spain | 94.9 /100 | #101 | Exceptional 2.8% |
| Taiwanese | 94.8 /100 | #102 | Exceptional 2.8% |
| Immigrants | Indonesia | 94.7 /100 | #103 | Exceptional 2.8% |
| Burmese | 94.2 /100 | #104 | Exceptional 2.8% |
| Moroccans | 93.9 /100 | #105 | Exceptional 2.8% |
| Hondurans | 93.4 /100 | #106 | Exceptional 2.8% |
| Immigrants | Chile | 93.4 /100 | #107 | Exceptional 2.8% |
Demographics Similar to Brazilians by Hearing Disability
In terms of hearing disability, the demographic groups most similar to Brazilians are Tongan (2.9%, a difference of 0.010%), Immigrants from Congo (2.9%, a difference of 0.020%), Immigrants from Bulgaria (2.9%, a difference of 0.070%), Immigrants from Russia (2.9%, a difference of 0.15%), and Immigrants from Panama (2.9%, a difference of 0.26%).
| Demographics | Rating | Rank | Hearing Disability |
| Bermudans | 83.8 /100 | #139 | Excellent 2.9% |
| Immigrants | Jordan | 83.7 /100 | #140 | Excellent 2.9% |
| Sub-Saharan Africans | 83.3 /100 | #141 | Excellent 2.9% |
| Laotians | 81.1 /100 | #142 | Excellent 2.9% |
| Immigrants | Bahamas | 80.9 /100 | #143 | Excellent 2.9% |
| Immigrants | Bulgaria | 79.2 /100 | #144 | Good 2.9% |
| Immigrants | Congo | 78.9 /100 | #145 | Good 2.9% |
| Brazilians | 78.7 /100 | #146 | Good 2.9% |
| Tongans | 78.6 /100 | #147 | Good 2.9% |
| Immigrants | Russia | 77.7 /100 | #148 | Good 2.9% |
| Immigrants | Panama | 76.9 /100 | #149 | Good 2.9% |
| Palestinians | 73.6 /100 | #150 | Good 2.9% |
| Immigrants | France | 73.1 /100 | #151 | Good 2.9% |
| Immigrants | Lithuania | 73.0 /100 | #152 | Good 2.9% |
| Sudanese | 72.1 /100 | #153 | Good 2.9% |