Immigrants from Eastern Africa vs Kenyan Hearing Disability
COMPARE
Immigrants from Eastern Africa
Kenyan
Hearing Disability
Hearing Disability Comparison
Immigrants from Eastern Africa
Kenyans
2.8%
HEARING DISABILITY
95.0/ 100
METRIC RATING
100th/ 347
METRIC RANK
2.8%
HEARING DISABILITY
89.8/ 100
METRIC RATING
119th/ 347
METRIC RANK
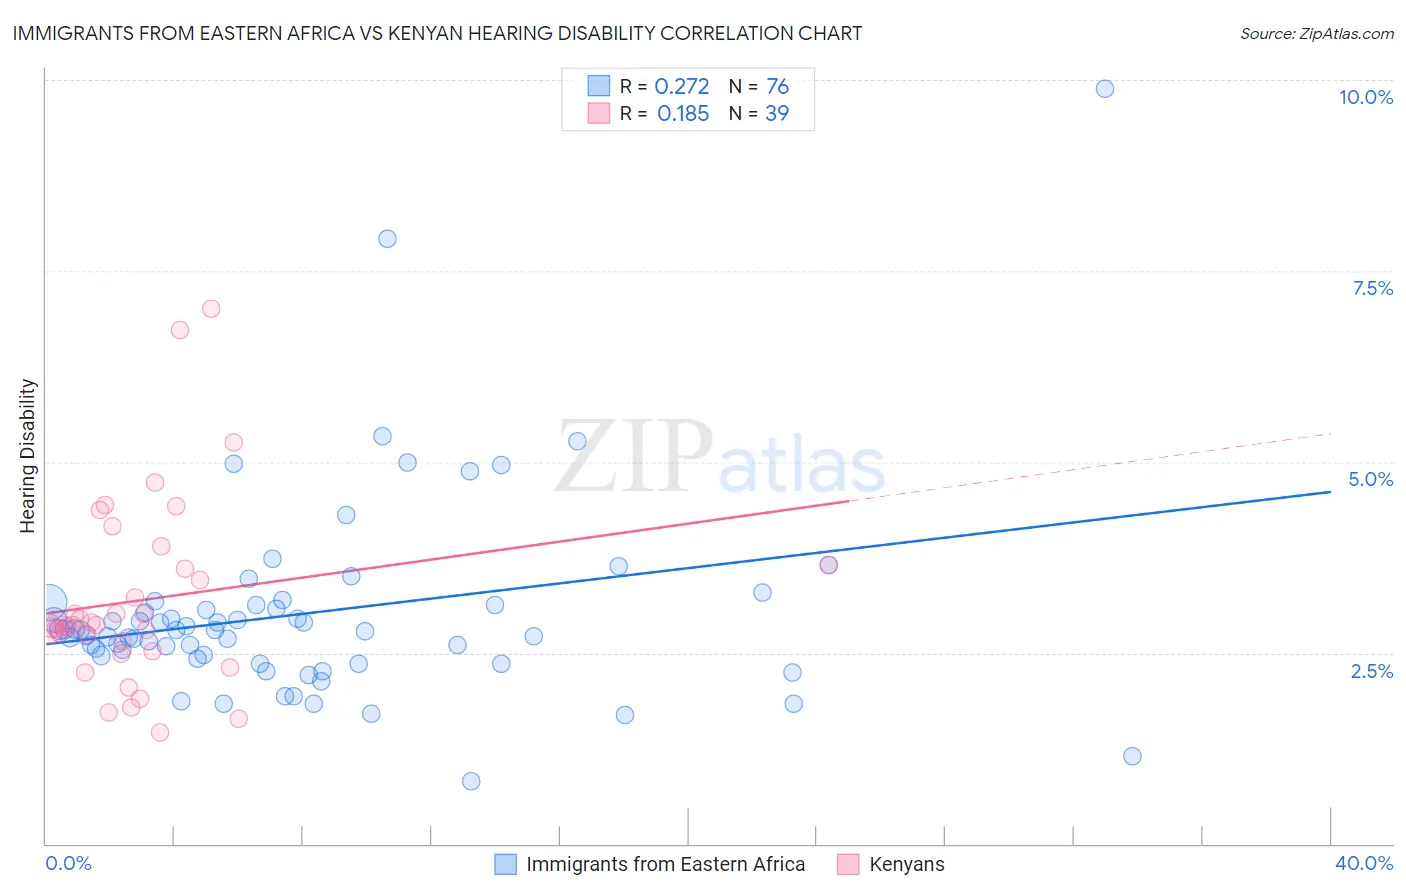
Immigrants from Eastern Africa vs Kenyan Hearing Disability Correlation Chart
The statistical analysis conducted on geographies consisting of 355,030,824 people shows a weak positive correlation between the proportion of Immigrants from Eastern Africa and percentage of population with hearing disability in the United States with a correlation coefficient (R) of 0.272 and weighted average of 2.8%. Similarly, the statistical analysis conducted on geographies consisting of 168,202,963 people shows a poor positive correlation between the proportion of Kenyans and percentage of population with hearing disability in the United States with a correlation coefficient (R) of 0.185 and weighted average of 2.8%, a difference of 1.9%.
Hearing Disability Correlation Summary
| Measurement | Immigrants from Eastern Africa | Kenyan |
| Minimum | 0.83% | 1.5% |
| Maximum | 9.9% | 7.0% |
| Range | 9.1% | 5.6% |
| Mean | 3.0% | 3.2% |
| Median | 2.8% | 2.9% |
| Interquartile 25% (IQ1) | 2.4% | 2.5% |
| Interquartile 75% (IQ3) | 3.1% | 3.6% |
| Interquartile Range (IQR) | 0.68% | 1.1% |
| Standard Deviation (Sample) | 1.3% | 1.2% |
| Standard Deviation (Population) | 1.3% | 1.2% |
Demographics Similar to Immigrants from Eastern Africa and Kenyans by Hearing Disability
In terms of hearing disability, the demographic groups most similar to Immigrants from Eastern Africa are Immigrants from Guatemala (2.8%, a difference of 0.050%), Immigrants from Spain (2.8%, a difference of 0.050%), Taiwanese (2.8%, a difference of 0.070%), Immigrants from Indonesia (2.8%, a difference of 0.12%), and Burmese (2.8%, a difference of 0.39%). Similarly, the demographic groups most similar to Kenyans are Zimbabwean (2.8%, a difference of 0.020%), Immigrants from Liberia (2.8%, a difference of 0.030%), Immigrants (2.8%, a difference of 0.12%), Immigrants from Latin America (2.8%, a difference of 0.18%), and Cambodian (2.8%, a difference of 0.36%).
| Demographics | Rating | Rank | Hearing Disability |
| Immigrants | Guatemala | 95.1 /100 | #99 | Exceptional 2.8% |
| Immigrants | Eastern Africa | 95.0 /100 | #100 | Exceptional 2.8% |
| Immigrants | Spain | 94.9 /100 | #101 | Exceptional 2.8% |
| Taiwanese | 94.8 /100 | #102 | Exceptional 2.8% |
| Immigrants | Indonesia | 94.7 /100 | #103 | Exceptional 2.8% |
| Burmese | 94.2 /100 | #104 | Exceptional 2.8% |
| Moroccans | 93.9 /100 | #105 | Exceptional 2.8% |
| Hondurans | 93.4 /100 | #106 | Exceptional 2.8% |
| Immigrants | Chile | 93.4 /100 | #107 | Exceptional 2.8% |
| Guatemalans | 93.2 /100 | #108 | Exceptional 2.8% |
| Turks | 93.0 /100 | #109 | Exceptional 2.8% |
| Cypriots | 92.9 /100 | #110 | Exceptional 2.8% |
| Immigrants | Yemen | 92.7 /100 | #111 | Exceptional 2.8% |
| U.S. Virgin Islanders | 92.5 /100 | #112 | Exceptional 2.8% |
| Immigrants | Belarus | 91.6 /100 | #113 | Exceptional 2.8% |
| Cambodians | 91.1 /100 | #114 | Exceptional 2.8% |
| Immigrants | Latin America | 90.5 /100 | #115 | Exceptional 2.8% |
| Immigrants | Immigrants | 90.3 /100 | #116 | Exceptional 2.8% |
| Immigrants | Liberia | 90.0 /100 | #117 | Excellent 2.8% |
| Zimbabweans | 89.9 /100 | #118 | Excellent 2.8% |
| Kenyans | 89.8 /100 | #119 | Excellent 2.8% |