Salvadoran vs Kenyan Hearing Disability
COMPARE
Salvadoran
Kenyan
Hearing Disability
Hearing Disability Comparison
Salvadorans
Kenyans
2.6%
HEARING DISABILITY
99.6/ 100
METRIC RATING
35th/ 347
METRIC RANK
2.8%
HEARING DISABILITY
89.8/ 100
METRIC RATING
119th/ 347
METRIC RANK
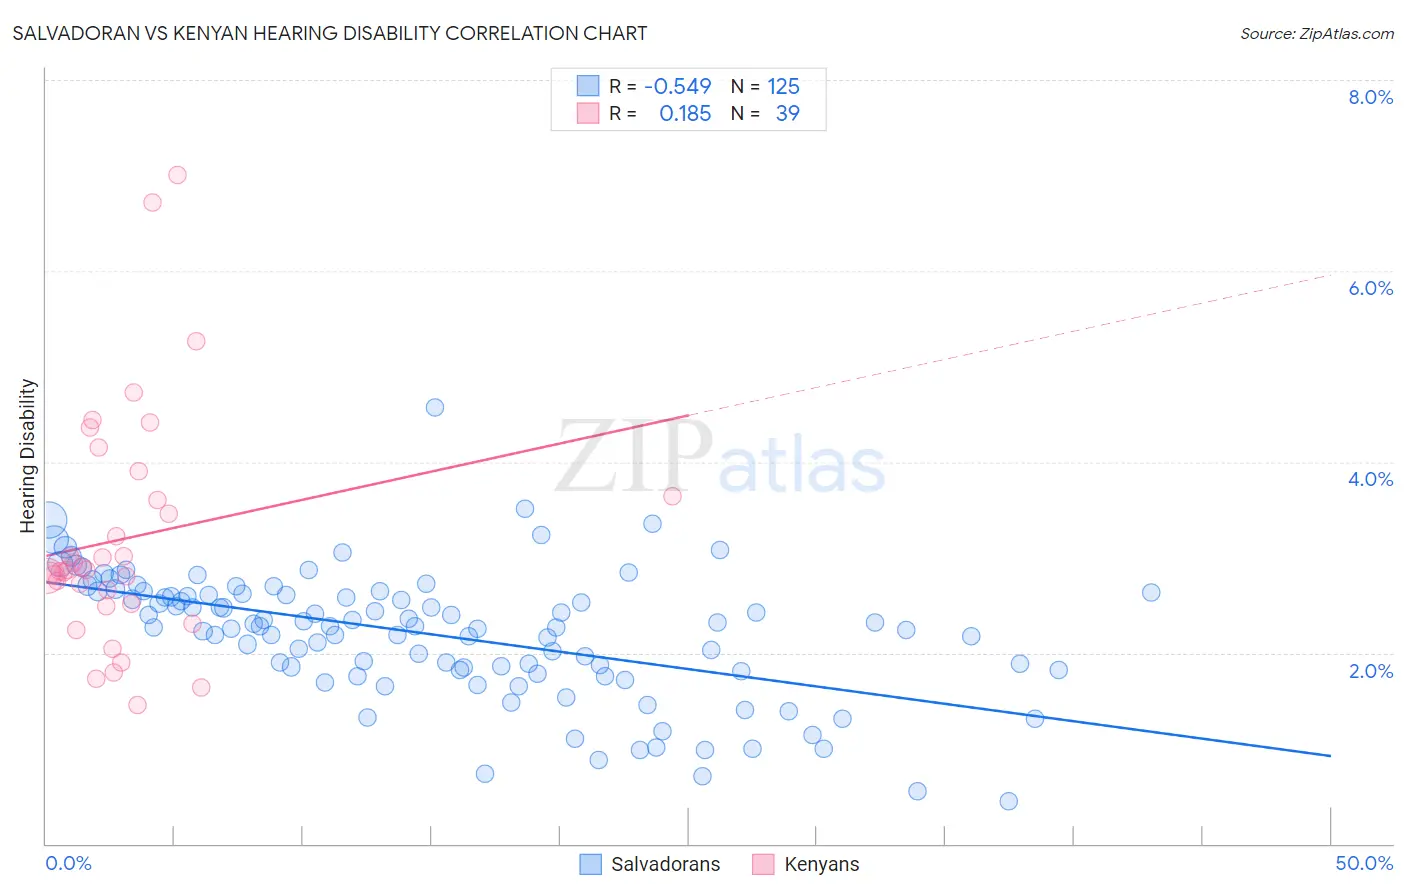
Salvadoran vs Kenyan Hearing Disability Correlation Chart
The statistical analysis conducted on geographies consisting of 398,804,647 people shows a substantial negative correlation between the proportion of Salvadorans and percentage of population with hearing disability in the United States with a correlation coefficient (R) of -0.549 and weighted average of 2.6%. Similarly, the statistical analysis conducted on geographies consisting of 168,202,963 people shows a poor positive correlation between the proportion of Kenyans and percentage of population with hearing disability in the United States with a correlation coefficient (R) of 0.185 and weighted average of 2.8%, a difference of 8.9%.
Hearing Disability Correlation Summary
| Measurement | Salvadoran | Kenyan |
| Minimum | 0.44% | 1.5% |
| Maximum | 4.6% | 7.0% |
| Range | 4.1% | 5.6% |
| Mean | 2.2% | 3.2% |
| Median | 2.3% | 2.9% |
| Interquartile 25% (IQ1) | 1.8% | 2.5% |
| Interquartile 75% (IQ3) | 2.6% | 3.6% |
| Interquartile Range (IQR) | 0.81% | 1.1% |
| Standard Deviation (Sample) | 0.67% | 1.2% |
| Standard Deviation (Population) | 0.67% | 1.2% |
Similar Demographics by Hearing Disability
Demographics Similar to Salvadorans by Hearing Disability
In terms of hearing disability, the demographic groups most similar to Salvadorans are Immigrants from Pakistan (2.6%, a difference of 0.12%), Filipino (2.6%, a difference of 0.16%), Okinawan (2.6%, a difference of 0.22%), Immigrants from Western Africa (2.6%, a difference of 0.25%), and Immigrants from Jamaica (2.6%, a difference of 0.33%).
| Demographics | Rating | Rank | Hearing Disability |
| Immigrants | Haiti | 99.7 /100 | #28 | Exceptional 2.6% |
| Bolivians | 99.7 /100 | #29 | Exceptional 2.6% |
| Immigrants | Caribbean | 99.7 /100 | #30 | Exceptional 2.6% |
| Immigrants | Cameroon | 99.7 /100 | #31 | Exceptional 2.6% |
| Immigrants | Venezuela | 99.7 /100 | #32 | Exceptional 2.6% |
| Filipinos | 99.6 /100 | #33 | Exceptional 2.6% |
| Immigrants | Pakistan | 99.6 /100 | #34 | Exceptional 2.6% |
| Salvadorans | 99.6 /100 | #35 | Exceptional 2.6% |
| Okinawans | 99.6 /100 | #36 | Exceptional 2.6% |
| Immigrants | Western Africa | 99.6 /100 | #37 | Exceptional 2.6% |
| Immigrants | Jamaica | 99.5 /100 | #38 | Exceptional 2.6% |
| Immigrants | China | 99.5 /100 | #39 | Exceptional 2.6% |
| Haitians | 99.5 /100 | #40 | Exceptional 2.6% |
| Immigrants | Taiwan | 99.4 /100 | #41 | Exceptional 2.6% |
| West Indians | 99.4 /100 | #42 | Exceptional 2.6% |
Demographics Similar to Kenyans by Hearing Disability
In terms of hearing disability, the demographic groups most similar to Kenyans are Zimbabwean (2.8%, a difference of 0.020%), Immigrants from Liberia (2.8%, a difference of 0.030%), Jordanian (2.8%, a difference of 0.090%), Immigrants (2.8%, a difference of 0.12%), and Cuban (2.8%, a difference of 0.12%).
| Demographics | Rating | Rank | Hearing Disability |
| U.S. Virgin Islanders | 92.5 /100 | #112 | Exceptional 2.8% |
| Immigrants | Belarus | 91.6 /100 | #113 | Exceptional 2.8% |
| Cambodians | 91.1 /100 | #114 | Exceptional 2.8% |
| Immigrants | Latin America | 90.5 /100 | #115 | Exceptional 2.8% |
| Immigrants | Immigrants | 90.3 /100 | #116 | Exceptional 2.8% |
| Immigrants | Liberia | 90.0 /100 | #117 | Excellent 2.8% |
| Zimbabweans | 89.9 /100 | #118 | Excellent 2.8% |
| Kenyans | 89.8 /100 | #119 | Excellent 2.8% |
| Jordanians | 89.5 /100 | #120 | Excellent 2.8% |
| Cubans | 89.4 /100 | #121 | Excellent 2.8% |
| Liberians | 89.0 /100 | #122 | Excellent 2.8% |
| Immigrants | Zaire | 88.6 /100 | #123 | Excellent 2.9% |
| Bahamians | 88.6 /100 | #124 | Excellent 2.9% |
| Immigrants | Albania | 88.5 /100 | #125 | Excellent 2.9% |
| Immigrants | Sudan | 87.8 /100 | #126 | Excellent 2.9% |