Immigrants from Colombia vs Puerto Rican Disability
COMPARE
Immigrants from Colombia
Puerto Rican
Disability
Disability Comparison
Immigrants from Colombia
Puerto Ricans
10.9%
DISABILITY
99.7/ 100
METRIC RATING
59th/ 347
METRIC RANK
16.1%
DISABILITY
0.0/ 100
METRIC RATING
345th/ 347
METRIC RANK
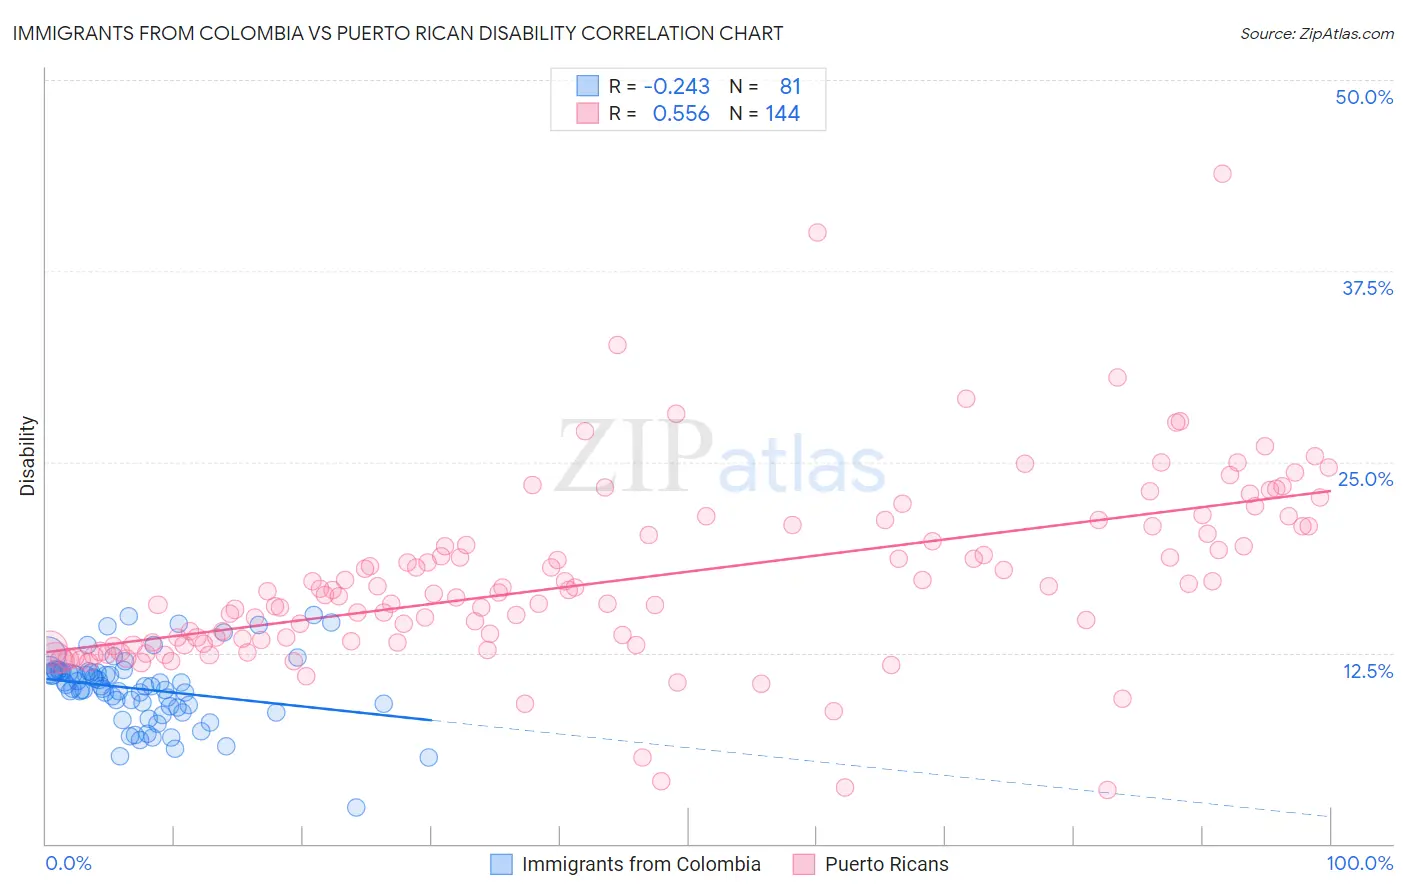
Immigrants from Colombia vs Puerto Rican Disability Correlation Chart
The statistical analysis conducted on geographies consisting of 378,650,675 people shows a weak negative correlation between the proportion of Immigrants from Colombia and percentage of population with a disability in the United States with a correlation coefficient (R) of -0.243 and weighted average of 10.9%. Similarly, the statistical analysis conducted on geographies consisting of 528,171,065 people shows a substantial positive correlation between the proportion of Puerto Ricans and percentage of population with a disability in the United States with a correlation coefficient (R) of 0.556 and weighted average of 16.1%, a difference of 47.4%.
Disability Correlation Summary
| Measurement | Immigrants from Colombia | Puerto Rican |
| Minimum | 2.4% | 3.6% |
| Maximum | 14.9% | 43.9% |
| Range | 12.5% | 40.3% |
| Mean | 10.1% | 17.2% |
| Median | 10.3% | 16.4% |
| Interquartile 25% (IQ1) | 8.9% | 13.2% |
| Interquartile 75% (IQ3) | 11.2% | 20.5% |
| Interquartile Range (IQR) | 2.3% | 7.4% |
| Standard Deviation (Sample) | 2.3% | 6.0% |
| Standard Deviation (Population) | 2.3% | 6.0% |
Similar Demographics by Disability
Demographics Similar to Immigrants from Colombia by Disability
In terms of disability, the demographic groups most similar to Immigrants from Colombia are Immigrants from South America (10.9%, a difference of 0.090%), Zimbabwean (10.9%, a difference of 0.090%), Salvadoran (10.9%, a difference of 0.12%), Immigrants from Bulgaria (10.9%, a difference of 0.15%), and Immigrants from Northern Africa (10.9%, a difference of 0.19%).
| Demographics | Rating | Rank | Disability |
| South Americans | 99.8 /100 | #52 | Exceptional 10.9% |
| Immigrants | Spain | 99.8 /100 | #53 | Exceptional 10.9% |
| Jordanians | 99.8 /100 | #54 | Exceptional 10.9% |
| Immigrants | El Salvador | 99.8 /100 | #55 | Exceptional 10.9% |
| Immigrants | Lithuania | 99.8 /100 | #56 | Exceptional 10.9% |
| Salvadorans | 99.8 /100 | #57 | Exceptional 10.9% |
| Immigrants | South America | 99.8 /100 | #58 | Exceptional 10.9% |
| Immigrants | Colombia | 99.7 /100 | #59 | Exceptional 10.9% |
| Zimbabweans | 99.7 /100 | #60 | Exceptional 10.9% |
| Immigrants | Bulgaria | 99.7 /100 | #61 | Exceptional 10.9% |
| Immigrants | Northern Africa | 99.7 /100 | #62 | Exceptional 10.9% |
| Immigrants | Eritrea | 99.7 /100 | #63 | Exceptional 11.0% |
| Immigrants | Sweden | 99.6 /100 | #64 | Exceptional 11.0% |
| Bulgarians | 99.6 /100 | #65 | Exceptional 11.0% |
| Laotians | 99.6 /100 | #66 | Exceptional 11.0% |
Demographics Similar to Puerto Ricans by Disability
In terms of disability, the demographic groups most similar to Puerto Ricans are Tsimshian (16.1%, a difference of 0.16%), Colville (15.8%, a difference of 2.0%), Creek (15.6%, a difference of 3.3%), Kiowa (15.6%, a difference of 3.3%), and Lumbee (15.5%, a difference of 3.8%).
| Demographics | Rating | Rank | Disability |
| Cajuns | 0.0 /100 | #333 | Tragic 14.6% |
| Yuman | 0.0 /100 | #334 | Tragic 14.6% |
| Tohono O'odham | 0.0 /100 | #335 | Tragic 14.8% |
| Cherokee | 0.0 /100 | #336 | Tragic 14.8% |
| Seminole | 0.0 /100 | #337 | Tragic 14.9% |
| Dutch West Indians | 0.0 /100 | #338 | Tragic 14.9% |
| Chickasaw | 0.0 /100 | #339 | Tragic 15.2% |
| Choctaw | 0.0 /100 | #340 | Tragic 15.4% |
| Lumbee | 0.0 /100 | #341 | Tragic 15.5% |
| Kiowa | 0.0 /100 | #342 | Tragic 15.6% |
| Creek | 0.0 /100 | #343 | Tragic 15.6% |
| Colville | 0.0 /100 | #344 | Tragic 15.8% |
| Puerto Ricans | 0.0 /100 | #345 | Tragic 16.1% |
| Tsimshian | 0.0 /100 | #346 | Tragic 16.1% |
| Houma | 0.0 /100 | #347 | Tragic 17.1% |