Immigrants from Colombia vs Syrian Single Mother Poverty
COMPARE
Immigrants from Colombia
Syrian
Single Mother Poverty
Single Mother Poverty Comparison
Immigrants from Colombia
Syrians
28.5%
SINGLE MOTHER POVERTY
88.0/ 100
METRIC RATING
140th/ 347
METRIC RANK
28.6%
SINGLE MOTHER POVERTY
85.3/ 100
METRIC RATING
148th/ 347
METRIC RANK
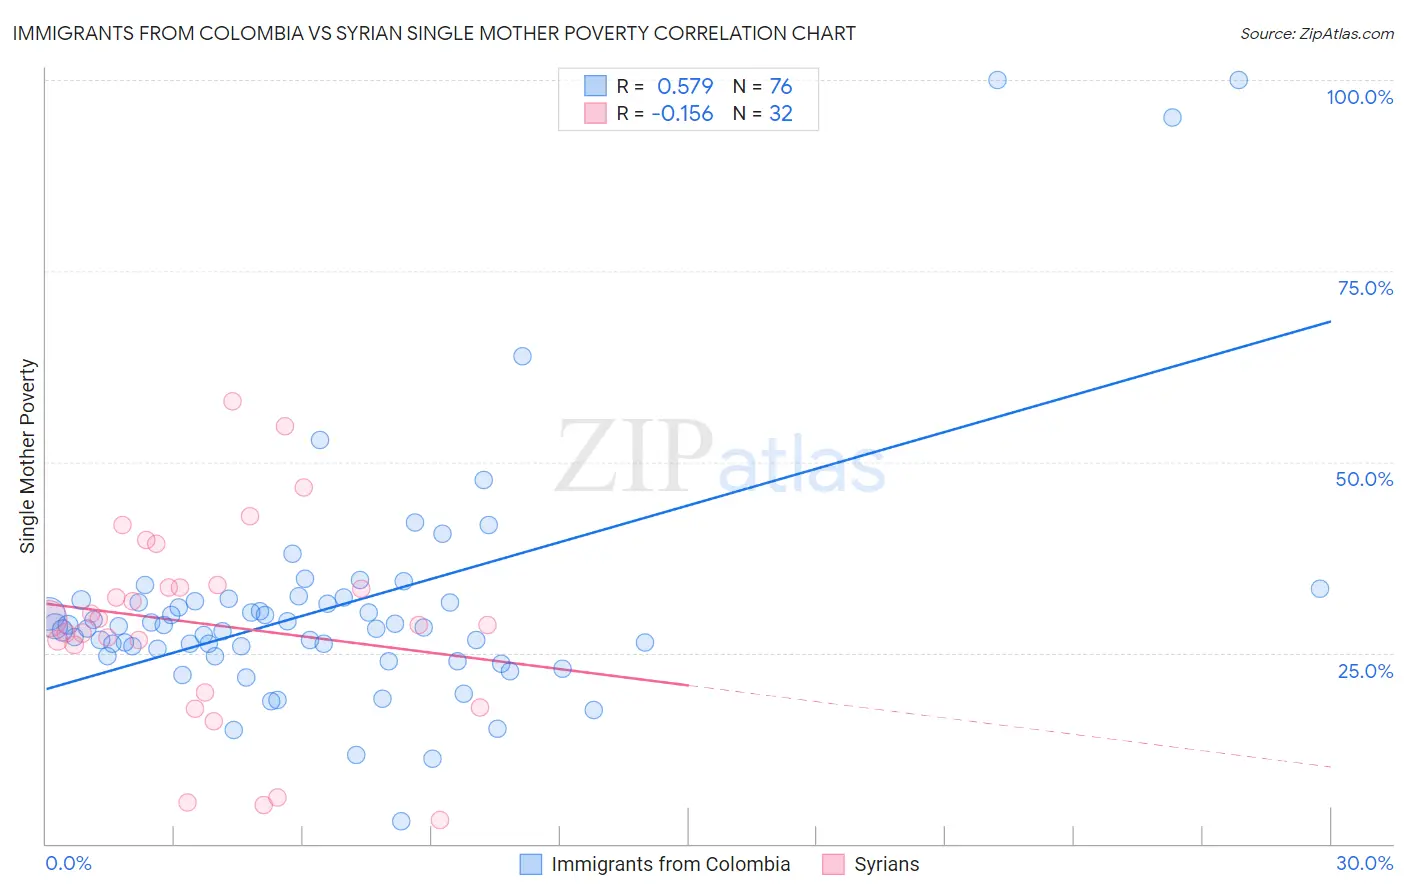
Immigrants from Colombia vs Syrian Single Mother Poverty Correlation Chart
The statistical analysis conducted on geographies consisting of 370,210,316 people shows a substantial positive correlation between the proportion of Immigrants from Colombia and poverty level among single mothers in the United States with a correlation coefficient (R) of 0.579 and weighted average of 28.5%. Similarly, the statistical analysis conducted on geographies consisting of 260,676,896 people shows a poor negative correlation between the proportion of Syrians and poverty level among single mothers in the United States with a correlation coefficient (R) of -0.156 and weighted average of 28.6%, a difference of 0.29%.
Single Mother Poverty Correlation Summary
| Measurement | Immigrants from Colombia | Syrian |
| Minimum | 2.9% | 3.1% |
| Maximum | 100.0% | 58.0% |
| Range | 97.1% | 54.9% |
| Mean | 31.0% | 28.8% |
| Median | 28.3% | 29.0% |
| Interquartile 25% (IQ1) | 25.1% | 22.9% |
| Interquartile 75% (IQ3) | 31.8% | 33.7% |
| Interquartile Range (IQR) | 6.7% | 10.8% |
| Standard Deviation (Sample) | 16.2% | 13.2% |
| Standard Deviation (Population) | 16.1% | 12.9% |
Demographics Similar to Immigrants from Colombia and Syrians by Single Mother Poverty
In terms of single mother poverty, the demographic groups most similar to Immigrants from Colombia are Samoan (28.5%, a difference of 0.010%), Immigrants from Belgium (28.5%, a difference of 0.060%), Danish (28.5%, a difference of 0.10%), Native Hawaiian (28.4%, a difference of 0.11%), and Immigrants from Canada (28.4%, a difference of 0.11%). Similarly, the demographic groups most similar to Syrians are Immigrants from Lebanon (28.6%, a difference of 0.010%), Serbian (28.6%, a difference of 0.020%), Immigrants from South America (28.5%, a difference of 0.080%), Immigrants from Denmark (28.5%, a difference of 0.080%), and Luxembourger (28.5%, a difference of 0.12%).
| Demographics | Rating | Rank | Single Mother Poverty |
| Immigrants | Southern Europe | 89.2 /100 | #134 | Excellent 28.4% |
| Immigrants | Spain | 89.2 /100 | #135 | Excellent 28.4% |
| Native Hawaiians | 88.9 /100 | #136 | Excellent 28.4% |
| Immigrants | Canada | 88.9 /100 | #137 | Excellent 28.4% |
| Immigrants | Belgium | 88.5 /100 | #138 | Excellent 28.5% |
| Samoans | 88.1 /100 | #139 | Excellent 28.5% |
| Immigrants | Colombia | 88.0 /100 | #140 | Excellent 28.5% |
| Danes | 87.1 /100 | #141 | Excellent 28.5% |
| South Africans | 86.6 /100 | #142 | Excellent 28.5% |
| Immigrants | North America | 86.5 /100 | #143 | Excellent 28.5% |
| Luxembourgers | 86.4 /100 | #144 | Excellent 28.5% |
| Immigrants | South America | 86.1 /100 | #145 | Excellent 28.5% |
| Immigrants | Denmark | 86.1 /100 | #146 | Excellent 28.5% |
| Immigrants | Lebanon | 85.3 /100 | #147 | Excellent 28.6% |
| Syrians | 85.3 /100 | #148 | Excellent 28.6% |
| Serbians | 85.0 /100 | #149 | Excellent 28.6% |
| Northern Europeans | 81.7 /100 | #150 | Excellent 28.6% |
| Immigrants | Oceania | 79.9 /100 | #151 | Good 28.7% |
| Austrians | 79.0 /100 | #152 | Good 28.7% |
| Slovenes | 76.4 /100 | #153 | Good 28.8% |
| Portuguese | 73.2 /100 | #154 | Good 28.8% |