Immigrants from Colombia vs Barbadian Disability
COMPARE
Immigrants from Colombia
Barbadian
Disability
Disability Comparison
Immigrants from Colombia
Barbadians
10.9%
DISABILITY
99.7/ 100
METRIC RATING
59th/ 347
METRIC RANK
11.9%
DISABILITY
15.8/ 100
METRIC RATING
195th/ 347
METRIC RANK
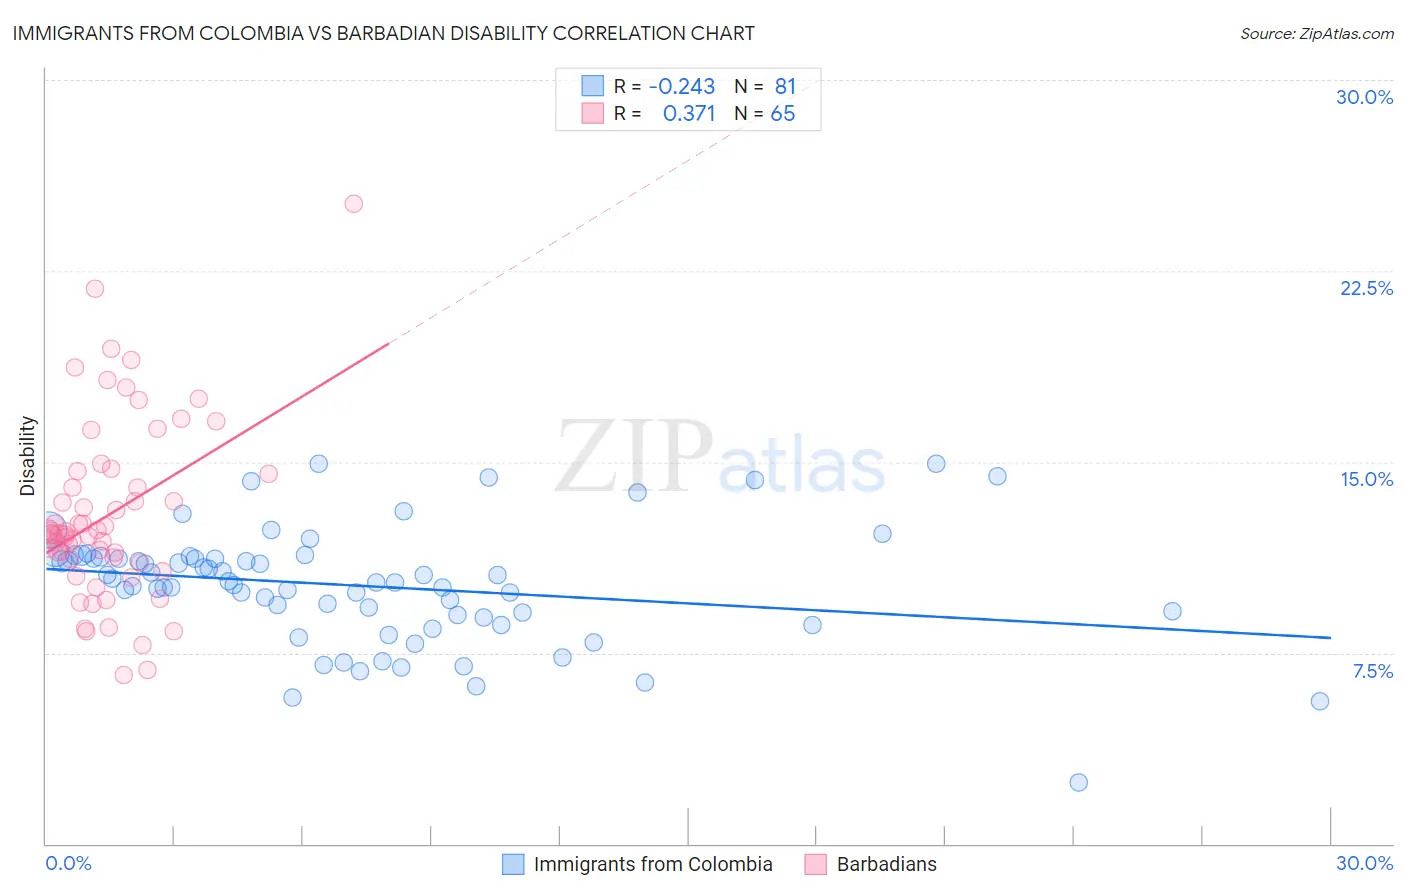
Immigrants from Colombia vs Barbadian Disability Correlation Chart
The statistical analysis conducted on geographies consisting of 378,650,675 people shows a weak negative correlation between the proportion of Immigrants from Colombia and percentage of population with a disability in the United States with a correlation coefficient (R) of -0.243 and weighted average of 10.9%. Similarly, the statistical analysis conducted on geographies consisting of 141,302,135 people shows a mild positive correlation between the proportion of Barbadians and percentage of population with a disability in the United States with a correlation coefficient (R) of 0.371 and weighted average of 11.9%, a difference of 9.0%.
Disability Correlation Summary
| Measurement | Immigrants from Colombia | Barbadian |
| Minimum | 2.4% | 6.6% |
| Maximum | 14.9% | 25.1% |
| Range | 12.5% | 18.5% |
| Mean | 10.1% | 12.9% |
| Median | 10.3% | 12.2% |
| Interquartile 25% (IQ1) | 8.9% | 11.1% |
| Interquartile 75% (IQ3) | 11.2% | 14.6% |
| Interquartile Range (IQR) | 2.3% | 3.4% |
| Standard Deviation (Sample) | 2.3% | 3.5% |
| Standard Deviation (Population) | 2.3% | 3.5% |
Similar Demographics by Disability
Demographics Similar to Immigrants from Colombia by Disability
In terms of disability, the demographic groups most similar to Immigrants from Colombia are Immigrants from South America (10.9%, a difference of 0.090%), Zimbabwean (10.9%, a difference of 0.090%), Salvadoran (10.9%, a difference of 0.12%), Immigrants from Bulgaria (10.9%, a difference of 0.15%), and Immigrants from Northern Africa (10.9%, a difference of 0.19%).
| Demographics | Rating | Rank | Disability |
| South Americans | 99.8 /100 | #52 | Exceptional 10.9% |
| Immigrants | Spain | 99.8 /100 | #53 | Exceptional 10.9% |
| Jordanians | 99.8 /100 | #54 | Exceptional 10.9% |
| Immigrants | El Salvador | 99.8 /100 | #55 | Exceptional 10.9% |
| Immigrants | Lithuania | 99.8 /100 | #56 | Exceptional 10.9% |
| Salvadorans | 99.8 /100 | #57 | Exceptional 10.9% |
| Immigrants | South America | 99.8 /100 | #58 | Exceptional 10.9% |
| Immigrants | Colombia | 99.7 /100 | #59 | Exceptional 10.9% |
| Zimbabweans | 99.7 /100 | #60 | Exceptional 10.9% |
| Immigrants | Bulgaria | 99.7 /100 | #61 | Exceptional 10.9% |
| Immigrants | Northern Africa | 99.7 /100 | #62 | Exceptional 10.9% |
| Immigrants | Eritrea | 99.7 /100 | #63 | Exceptional 11.0% |
| Immigrants | Sweden | 99.6 /100 | #64 | Exceptional 11.0% |
| Bulgarians | 99.6 /100 | #65 | Exceptional 11.0% |
| Laotians | 99.6 /100 | #66 | Exceptional 11.0% |
Demographics Similar to Barbadians by Disability
In terms of disability, the demographic groups most similar to Barbadians are Serbian (11.9%, a difference of 0.040%), Immigrants from Belize (11.9%, a difference of 0.050%), Ukrainian (11.9%, a difference of 0.10%), Immigrants from Panama (11.9%, a difference of 0.10%), and Somali (11.9%, a difference of 0.11%).
| Demographics | Rating | Rank | Disability |
| Immigrants | Mexico | 23.8 /100 | #188 | Fair 11.9% |
| Immigrants | Zaire | 21.8 /100 | #189 | Fair 11.9% |
| Immigrants | West Indies | 21.1 /100 | #190 | Fair 11.9% |
| Ute | 19.5 /100 | #191 | Poor 11.9% |
| Lithuanians | 18.8 /100 | #192 | Poor 11.9% |
| Immigrants | Bosnia and Herzegovina | 18.0 /100 | #193 | Poor 11.9% |
| Somalis | 17.3 /100 | #194 | Poor 11.9% |
| Barbadians | 15.8 /100 | #195 | Poor 11.9% |
| Serbians | 15.4 /100 | #196 | Poor 11.9% |
| Immigrants | Belize | 15.2 /100 | #197 | Poor 11.9% |
| Ukrainians | 14.7 /100 | #198 | Poor 11.9% |
| Immigrants | Panama | 14.6 /100 | #199 | Poor 11.9% |
| Belizeans | 12.8 /100 | #200 | Poor 11.9% |
| Assyrians/Chaldeans/Syriacs | 12.6 /100 | #201 | Poor 11.9% |
| Immigrants | England | 12.0 /100 | #202 | Poor 12.0% |