Immigrants from Colombia vs Immigrants from Europe Disability Age Under 5
COMPARE
Immigrants from Colombia
Immigrants from Europe
Disability Age Under 5
Disability Age Under 5 Comparison
Immigrants from Colombia
Immigrants from Europe
1.2%
DISABILITY AGE UNDER 5
79.3/ 100
METRIC RATING
142nd/ 347
METRIC RANK
1.3%
DISABILITY AGE UNDER 5
23.6/ 100
METRIC RATING
204th/ 347
METRIC RANK
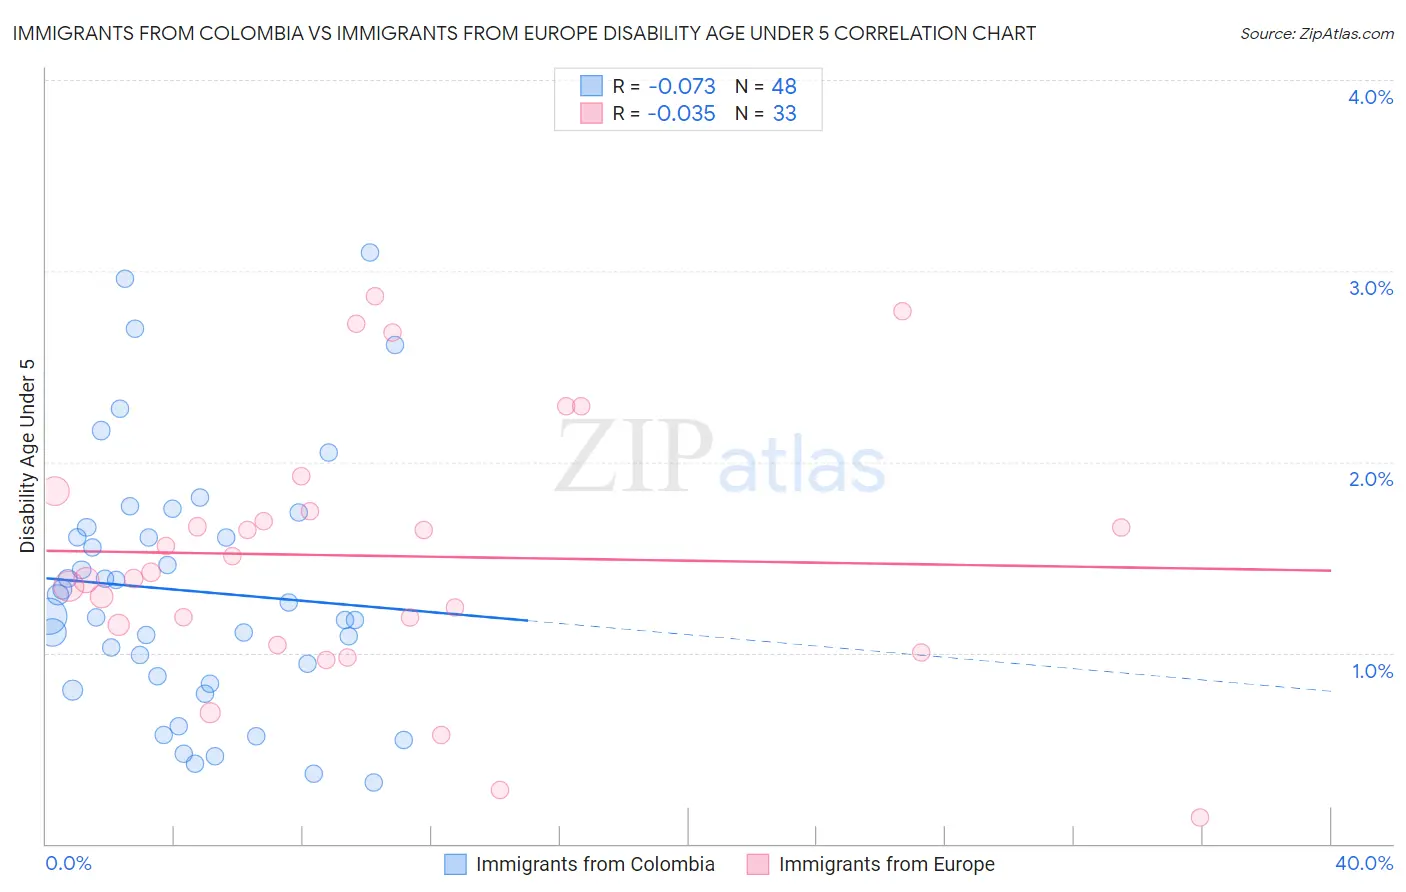
Immigrants from Colombia vs Immigrants from Europe Disability Age Under 5 Correlation Chart
The statistical analysis conducted on geographies consisting of 209,665,961 people shows a slight negative correlation between the proportion of Immigrants from Colombia and percentage of population with a disability under the age of 5 in the United States with a correlation coefficient (R) of -0.073 and weighted average of 1.2%. Similarly, the statistical analysis conducted on geographies consisting of 257,665,237 people shows no correlation between the proportion of Immigrants from Europe and percentage of population with a disability under the age of 5 in the United States with a correlation coefficient (R) of -0.035 and weighted average of 1.3%, a difference of 5.9%.
Disability Age Under 5 Correlation Summary
| Measurement | Immigrants from Colombia | Immigrants from Europe |
| Minimum | 0.32% | 0.14% |
| Maximum | 3.1% | 2.9% |
| Range | 2.8% | 2.7% |
| Mean | 1.3% | 1.5% |
| Median | 1.2% | 1.4% |
| Interquartile 25% (IQ1) | 0.86% | 1.1% |
| Interquartile 75% (IQ3) | 1.6% | 1.8% |
| Interquartile Range (IQR) | 0.78% | 0.70% |
| Standard Deviation (Sample) | 0.67% | 0.67% |
| Standard Deviation (Population) | 0.66% | 0.66% |
Similar Demographics by Disability Age Under 5
Demographics Similar to Immigrants from Colombia by Disability Age Under 5
In terms of disability age under 5, the demographic groups most similar to Immigrants from Colombia are Alsatian (1.2%, a difference of 0.010%), Immigrants from Middle Africa (1.2%, a difference of 0.010%), Immigrants from Honduras (1.2%, a difference of 0.15%), Immigrants from Zimbabwe (1.2%, a difference of 0.19%), and Somali (1.2%, a difference of 0.21%).
| Demographics | Rating | Rank | Disability Age Under 5 |
| Fijians | 84.7 /100 | #135 | Excellent 1.2% |
| Moroccans | 83.6 /100 | #136 | Excellent 1.2% |
| Immigrants | Eastern Africa | 83.1 /100 | #137 | Excellent 1.2% |
| Immigrants | Czechoslovakia | 82.8 /100 | #138 | Excellent 1.2% |
| New Zealanders | 81.4 /100 | #139 | Excellent 1.2% |
| Somalis | 80.8 /100 | #140 | Excellent 1.2% |
| Immigrants | Honduras | 80.4 /100 | #141 | Excellent 1.2% |
| Immigrants | Colombia | 79.3 /100 | #142 | Good 1.2% |
| Alsatians | 79.3 /100 | #143 | Good 1.2% |
| Immigrants | Middle Africa | 79.3 /100 | #144 | Good 1.2% |
| Immigrants | Zimbabwe | 77.9 /100 | #145 | Good 1.2% |
| Samoans | 77.7 /100 | #146 | Good 1.2% |
| Icelanders | 76.3 /100 | #147 | Good 1.2% |
| Ghanaians | 76.3 /100 | #148 | Good 1.2% |
| Kenyans | 75.9 /100 | #149 | Good 1.2% |
Demographics Similar to Immigrants from Europe by Disability Age Under 5
In terms of disability age under 5, the demographic groups most similar to Immigrants from Europe are Liberian (1.3%, a difference of 0.050%), Arapaho (1.3%, a difference of 0.060%), Romanian (1.3%, a difference of 0.14%), Immigrants from Poland (1.3%, a difference of 0.16%), and Immigrants from Italy (1.3%, a difference of 0.21%).
| Demographics | Rating | Rank | Disability Age Under 5 |
| Immigrants | Somalia | 31.3 /100 | #197 | Fair 1.3% |
| Immigrants | Norway | 31.1 /100 | #198 | Fair 1.3% |
| Jamaicans | 30.7 /100 | #199 | Fair 1.3% |
| Immigrants | Lithuania | 27.2 /100 | #200 | Fair 1.3% |
| Immigrants | Italy | 25.4 /100 | #201 | Fair 1.3% |
| Arapaho | 24.1 /100 | #202 | Fair 1.3% |
| Liberians | 24.0 /100 | #203 | Fair 1.3% |
| Immigrants | Europe | 23.6 /100 | #204 | Fair 1.3% |
| Romanians | 22.5 /100 | #205 | Fair 1.3% |
| Immigrants | Poland | 22.4 /100 | #206 | Fair 1.3% |
| Nigerians | 21.2 /100 | #207 | Fair 1.3% |
| Mexicans | 20.8 /100 | #208 | Fair 1.3% |
| Bulgarians | 19.5 /100 | #209 | Poor 1.3% |
| Pakistanis | 19.4 /100 | #210 | Poor 1.3% |
| Immigrants | Greece | 19.1 /100 | #211 | Poor 1.3% |