Hmong vs Immigrants from Europe Disability Age Under 5
COMPARE
Hmong
Immigrants from Europe
Disability Age Under 5
Disability Age Under 5 Comparison
Hmong
Immigrants from Europe
1.1%
DISABILITY AGE UNDER 5
98.0/ 100
METRIC RATING
79th/ 347
METRIC RANK
1.3%
DISABILITY AGE UNDER 5
23.6/ 100
METRIC RATING
204th/ 347
METRIC RANK
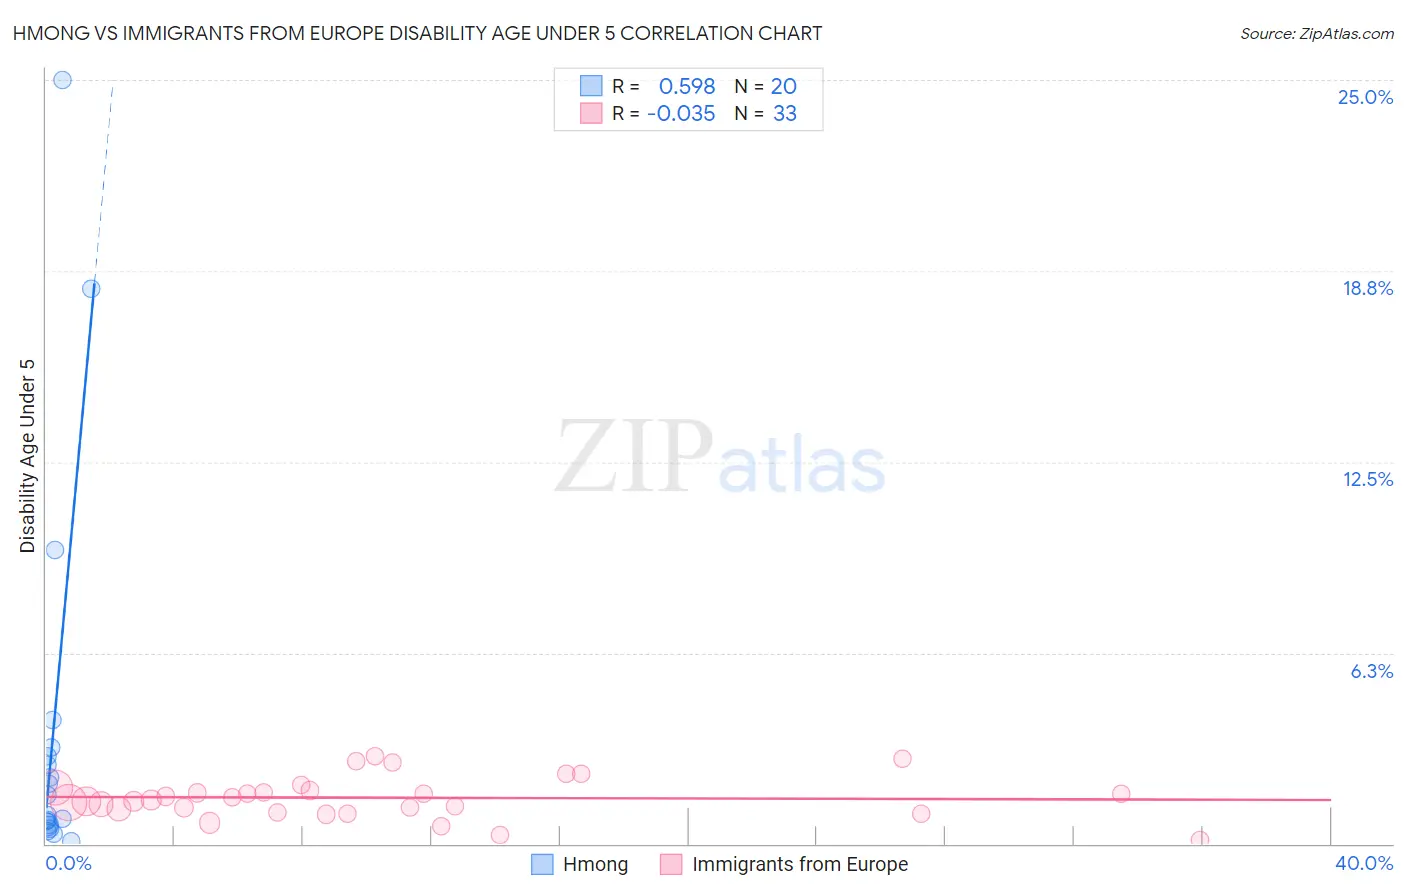
Hmong vs Immigrants from Europe Disability Age Under 5 Correlation Chart
The statistical analysis conducted on geographies consisting of 22,687,572 people shows a substantial positive correlation between the proportion of Hmong and percentage of population with a disability under the age of 5 in the United States with a correlation coefficient (R) of 0.598 and weighted average of 1.1%. Similarly, the statistical analysis conducted on geographies consisting of 257,665,237 people shows no correlation between the proportion of Immigrants from Europe and percentage of population with a disability under the age of 5 in the United States with a correlation coefficient (R) of -0.035 and weighted average of 1.3%, a difference of 12.6%.
Disability Age Under 5 Correlation Summary
| Measurement | Hmong | Immigrants from Europe |
| Minimum | 0.097% | 0.14% |
| Maximum | 25.0% | 2.9% |
| Range | 24.9% | 2.7% |
| Mean | 3.9% | 1.5% |
| Median | 1.3% | 1.4% |
| Interquartile 25% (IQ1) | 0.61% | 1.1% |
| Interquartile 75% (IQ3) | 3.0% | 1.8% |
| Interquartile Range (IQR) | 2.4% | 0.70% |
| Standard Deviation (Sample) | 6.5% | 0.67% |
| Standard Deviation (Population) | 6.4% | 0.66% |
Similar Demographics by Disability Age Under 5
Demographics Similar to Hmong by Disability Age Under 5
In terms of disability age under 5, the demographic groups most similar to Hmong are West Indian (1.1%, a difference of 0.020%), Immigrants from Trinidad and Tobago (1.1%, a difference of 0.020%), Turkish (1.1%, a difference of 0.040%), Immigrants from Denmark (1.1%, a difference of 0.14%), and Immigrants from Jordan (1.1%, a difference of 0.16%).
| Demographics | Rating | Rank | Disability Age Under 5 |
| Burmese | 98.5 /100 | #72 | Exceptional 1.1% |
| Immigrants | Sri Lanka | 98.5 /100 | #73 | Exceptional 1.1% |
| Jordanians | 98.5 /100 | #74 | Exceptional 1.1% |
| Immigrants | Pakistan | 98.4 /100 | #75 | Exceptional 1.1% |
| Immigrants | Burma/Myanmar | 98.2 /100 | #76 | Exceptional 1.1% |
| Immigrants | Denmark | 98.1 /100 | #77 | Exceptional 1.1% |
| West Indians | 98.0 /100 | #78 | Exceptional 1.1% |
| Hmong | 98.0 /100 | #79 | Exceptional 1.1% |
| Immigrants | Trinidad and Tobago | 98.0 /100 | #80 | Exceptional 1.1% |
| Turks | 98.0 /100 | #81 | Exceptional 1.1% |
| Immigrants | Jordan | 97.9 /100 | #82 | Exceptional 1.1% |
| Immigrants | Syria | 97.9 /100 | #83 | Exceptional 1.1% |
| Immigrants | Zaire | 97.8 /100 | #84 | Exceptional 1.1% |
| Sudanese | 97.7 /100 | #85 | Exceptional 1.1% |
| Okinawans | 97.6 /100 | #86 | Exceptional 1.1% |
Demographics Similar to Immigrants from Europe by Disability Age Under 5
In terms of disability age under 5, the demographic groups most similar to Immigrants from Europe are Liberian (1.3%, a difference of 0.050%), Arapaho (1.3%, a difference of 0.060%), Romanian (1.3%, a difference of 0.14%), Immigrants from Poland (1.3%, a difference of 0.16%), and Immigrants from Italy (1.3%, a difference of 0.21%).
| Demographics | Rating | Rank | Disability Age Under 5 |
| Immigrants | Somalia | 31.3 /100 | #197 | Fair 1.3% |
| Immigrants | Norway | 31.1 /100 | #198 | Fair 1.3% |
| Jamaicans | 30.7 /100 | #199 | Fair 1.3% |
| Immigrants | Lithuania | 27.2 /100 | #200 | Fair 1.3% |
| Immigrants | Italy | 25.4 /100 | #201 | Fair 1.3% |
| Arapaho | 24.1 /100 | #202 | Fair 1.3% |
| Liberians | 24.0 /100 | #203 | Fair 1.3% |
| Immigrants | Europe | 23.6 /100 | #204 | Fair 1.3% |
| Romanians | 22.5 /100 | #205 | Fair 1.3% |
| Immigrants | Poland | 22.4 /100 | #206 | Fair 1.3% |
| Nigerians | 21.2 /100 | #207 | Fair 1.3% |
| Mexicans | 20.8 /100 | #208 | Fair 1.3% |
| Bulgarians | 19.5 /100 | #209 | Poor 1.3% |
| Pakistanis | 19.4 /100 | #210 | Poor 1.3% |
| Immigrants | Greece | 19.1 /100 | #211 | Poor 1.3% |