Immigrants from Colombia vs Immigrants from Ireland Disability Age Under 5
COMPARE
Immigrants from Colombia
Immigrants from Ireland
Disability Age Under 5
Disability Age Under 5 Comparison
Immigrants from Colombia
Immigrants from Ireland
1.2%
DISABILITY AGE UNDER 5
79.3/ 100
METRIC RATING
142nd/ 347
METRIC RANK
1.2%
DISABILITY AGE UNDER 5
50.3/ 100
METRIC RATING
173rd/ 347
METRIC RANK
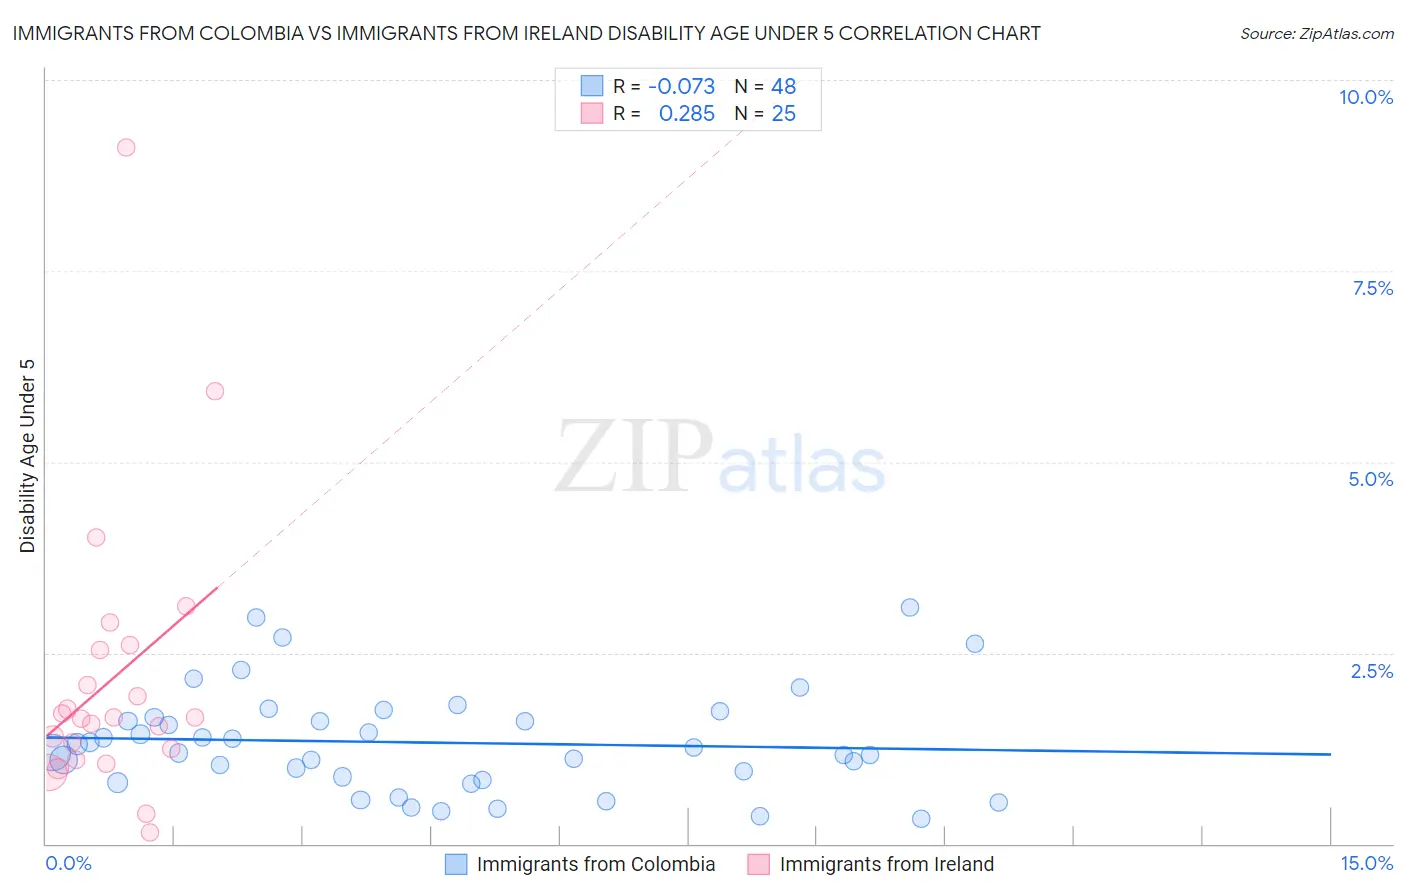
Immigrants from Colombia vs Immigrants from Ireland Disability Age Under 5 Correlation Chart
The statistical analysis conducted on geographies consisting of 209,665,961 people shows a slight negative correlation between the proportion of Immigrants from Colombia and percentage of population with a disability under the age of 5 in the United States with a correlation coefficient (R) of -0.073 and weighted average of 1.2%. Similarly, the statistical analysis conducted on geographies consisting of 143,988,066 people shows a weak positive correlation between the proportion of Immigrants from Ireland and percentage of population with a disability under the age of 5 in the United States with a correlation coefficient (R) of 0.285 and weighted average of 1.2%, a difference of 3.1%.
Disability Age Under 5 Correlation Summary
| Measurement | Immigrants from Colombia | Immigrants from Ireland |
| Minimum | 0.32% | 0.14% |
| Maximum | 3.1% | 9.1% |
| Range | 2.8% | 9.0% |
| Mean | 1.3% | 2.2% |
| Median | 1.2% | 1.7% |
| Interquartile 25% (IQ1) | 0.86% | 1.2% |
| Interquartile 75% (IQ3) | 1.6% | 2.6% |
| Interquartile Range (IQR) | 0.78% | 1.4% |
| Standard Deviation (Sample) | 0.67% | 1.9% |
| Standard Deviation (Population) | 0.66% | 1.8% |
Similar Demographics by Disability Age Under 5
Demographics Similar to Immigrants from Colombia by Disability Age Under 5
In terms of disability age under 5, the demographic groups most similar to Immigrants from Colombia are Alsatian (1.2%, a difference of 0.010%), Immigrants from Middle Africa (1.2%, a difference of 0.010%), Immigrants from Honduras (1.2%, a difference of 0.15%), Immigrants from Zimbabwe (1.2%, a difference of 0.19%), and Somali (1.2%, a difference of 0.21%).
| Demographics | Rating | Rank | Disability Age Under 5 |
| Fijians | 84.7 /100 | #135 | Excellent 1.2% |
| Moroccans | 83.6 /100 | #136 | Excellent 1.2% |
| Immigrants | Eastern Africa | 83.1 /100 | #137 | Excellent 1.2% |
| Immigrants | Czechoslovakia | 82.8 /100 | #138 | Excellent 1.2% |
| New Zealanders | 81.4 /100 | #139 | Excellent 1.2% |
| Somalis | 80.8 /100 | #140 | Excellent 1.2% |
| Immigrants | Honduras | 80.4 /100 | #141 | Excellent 1.2% |
| Immigrants | Colombia | 79.3 /100 | #142 | Good 1.2% |
| Alsatians | 79.3 /100 | #143 | Good 1.2% |
| Immigrants | Middle Africa | 79.3 /100 | #144 | Good 1.2% |
| Immigrants | Zimbabwe | 77.9 /100 | #145 | Good 1.2% |
| Samoans | 77.7 /100 | #146 | Good 1.2% |
| Icelanders | 76.3 /100 | #147 | Good 1.2% |
| Ghanaians | 76.3 /100 | #148 | Good 1.2% |
| Kenyans | 75.9 /100 | #149 | Good 1.2% |
Demographics Similar to Immigrants from Ireland by Disability Age Under 5
In terms of disability age under 5, the demographic groups most similar to Immigrants from Ireland are Immigrants from Latvia (1.2%, a difference of 0.020%), Immigrants from Nigeria (1.2%, a difference of 0.030%), Crow (1.2%, a difference of 0.070%), Immigrants from Kenya (1.2%, a difference of 0.15%), and Comanche (1.2%, a difference of 0.25%).
| Demographics | Rating | Rank | Disability Age Under 5 |
| Immigrants | Central America | 61.4 /100 | #166 | Good 1.2% |
| Immigrants | Argentina | 60.2 /100 | #167 | Good 1.2% |
| Sierra Leoneans | 59.1 /100 | #168 | Average 1.2% |
| Immigrants | Uruguay | 59.0 /100 | #169 | Average 1.2% |
| Immigrants | Jamaica | 58.8 /100 | #170 | Average 1.2% |
| Guamanians/Chamorros | 57.8 /100 | #171 | Average 1.2% |
| Crow | 51.0 /100 | #172 | Average 1.2% |
| Immigrants | Ireland | 50.3 /100 | #173 | Average 1.2% |
| Immigrants | Latvia | 50.0 /100 | #174 | Average 1.2% |
| Immigrants | Nigeria | 50.0 /100 | #175 | Average 1.2% |
| Immigrants | Kenya | 48.6 /100 | #176 | Average 1.2% |
| Comanche | 47.5 /100 | #177 | Average 1.2% |
| Venezuelans | 47.1 /100 | #178 | Average 1.2% |
| Immigrants | Bahamas | 45.2 /100 | #179 | Average 1.2% |
| Immigrants | Mexico | 44.4 /100 | #180 | Average 1.2% |