Immigrants from Colombia vs Immigrants from Senegal Disability Age Under 5
COMPARE
Immigrants from Colombia
Immigrants from Senegal
Disability Age Under 5
Disability Age Under 5 Comparison
Immigrants from Colombia
Immigrants from Senegal
1.2%
DISABILITY AGE UNDER 5
79.3/ 100
METRIC RATING
142nd/ 347
METRIC RANK
1.2%
DISABILITY AGE UNDER 5
91.4/ 100
METRIC RATING
121st/ 347
METRIC RANK
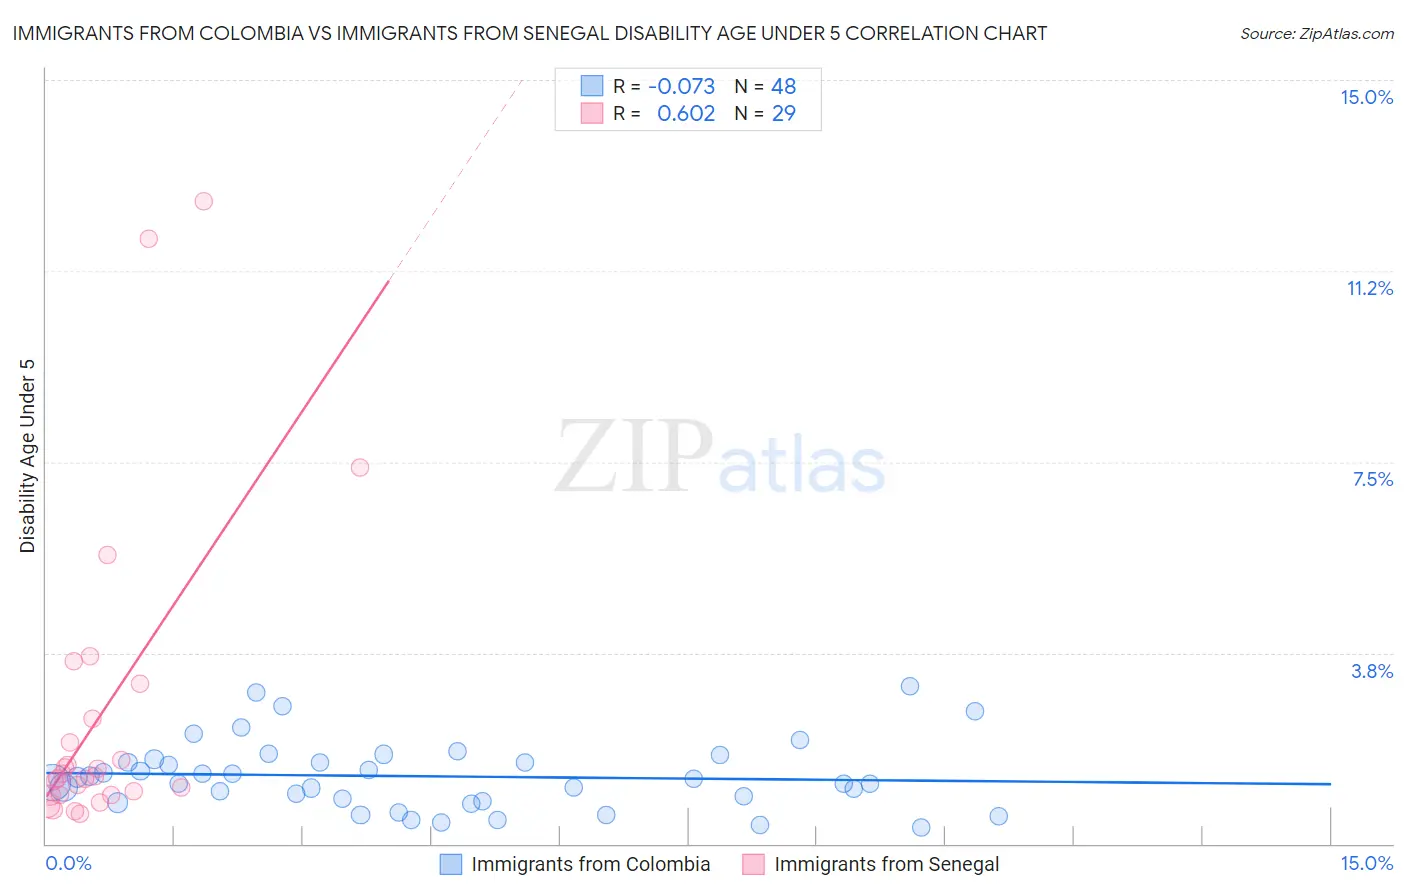
Immigrants from Colombia vs Immigrants from Senegal Disability Age Under 5 Correlation Chart
The statistical analysis conducted on geographies consisting of 209,665,961 people shows a slight negative correlation between the proportion of Immigrants from Colombia and percentage of population with a disability under the age of 5 in the United States with a correlation coefficient (R) of -0.073 and weighted average of 1.2%. Similarly, the statistical analysis conducted on geographies consisting of 70,932,249 people shows a significant positive correlation between the proportion of Immigrants from Senegal and percentage of population with a disability under the age of 5 in the United States with a correlation coefficient (R) of 0.602 and weighted average of 1.2%, a difference of 2.4%.
Disability Age Under 5 Correlation Summary
| Measurement | Immigrants from Colombia | Immigrants from Senegal |
| Minimum | 0.32% | 0.59% |
| Maximum | 3.1% | 12.6% |
| Range | 2.8% | 12.0% |
| Mean | 1.3% | 2.6% |
| Median | 1.2% | 1.3% |
| Interquartile 25% (IQ1) | 0.86% | 0.96% |
| Interquartile 75% (IQ3) | 1.6% | 2.8% |
| Interquartile Range (IQR) | 0.78% | 1.8% |
| Standard Deviation (Sample) | 0.67% | 3.1% |
| Standard Deviation (Population) | 0.66% | 3.0% |
Similar Demographics by Disability Age Under 5
Demographics Similar to Immigrants from Colombia by Disability Age Under 5
In terms of disability age under 5, the demographic groups most similar to Immigrants from Colombia are Alsatian (1.2%, a difference of 0.010%), Immigrants from Middle Africa (1.2%, a difference of 0.010%), Immigrants from Honduras (1.2%, a difference of 0.15%), Immigrants from Zimbabwe (1.2%, a difference of 0.19%), and Somali (1.2%, a difference of 0.21%).
| Demographics | Rating | Rank | Disability Age Under 5 |
| Fijians | 84.7 /100 | #135 | Excellent 1.2% |
| Moroccans | 83.6 /100 | #136 | Excellent 1.2% |
| Immigrants | Eastern Africa | 83.1 /100 | #137 | Excellent 1.2% |
| Immigrants | Czechoslovakia | 82.8 /100 | #138 | Excellent 1.2% |
| New Zealanders | 81.4 /100 | #139 | Excellent 1.2% |
| Somalis | 80.8 /100 | #140 | Excellent 1.2% |
| Immigrants | Honduras | 80.4 /100 | #141 | Excellent 1.2% |
| Immigrants | Colombia | 79.3 /100 | #142 | Good 1.2% |
| Alsatians | 79.3 /100 | #143 | Good 1.2% |
| Immigrants | Middle Africa | 79.3 /100 | #144 | Good 1.2% |
| Immigrants | Zimbabwe | 77.9 /100 | #145 | Good 1.2% |
| Samoans | 77.7 /100 | #146 | Good 1.2% |
| Icelanders | 76.3 /100 | #147 | Good 1.2% |
| Ghanaians | 76.3 /100 | #148 | Good 1.2% |
| Kenyans | 75.9 /100 | #149 | Good 1.2% |
Demographics Similar to Immigrants from Senegal by Disability Age Under 5
In terms of disability age under 5, the demographic groups most similar to Immigrants from Senegal are Aleut (1.2%, a difference of 0.19%), Zimbabwean (1.2%, a difference of 0.24%), Immigrants from Cambodia (1.2%, a difference of 0.26%), Immigrants from Eritrea (1.2%, a difference of 0.28%), and Japanese (1.2%, a difference of 0.32%).
| Demographics | Rating | Rank | Disability Age Under 5 |
| Belizeans | 93.9 /100 | #114 | Exceptional 1.2% |
| Immigrants | Caribbean | 93.8 /100 | #115 | Exceptional 1.2% |
| Immigrants | Northern Africa | 93.8 /100 | #116 | Exceptional 1.2% |
| Immigrants | Philippines | 93.5 /100 | #117 | Exceptional 1.2% |
| Immigrants | Venezuela | 93.4 /100 | #118 | Exceptional 1.2% |
| Bhutanese | 92.5 /100 | #119 | Exceptional 1.2% |
| Immigrants | Eritrea | 92.3 /100 | #120 | Exceptional 1.2% |
| Immigrants | Senegal | 91.4 /100 | #121 | Exceptional 1.2% |
| Aleuts | 90.7 /100 | #122 | Exceptional 1.2% |
| Zimbabweans | 90.6 /100 | #123 | Exceptional 1.2% |
| Immigrants | Cambodia | 90.5 /100 | #124 | Exceptional 1.2% |
| Japanese | 90.3 /100 | #125 | Exceptional 1.2% |
| Central Americans | 89.7 /100 | #126 | Excellent 1.2% |
| Immigrants | Romania | 88.4 /100 | #127 | Excellent 1.2% |
| Immigrants | France | 88.4 /100 | #128 | Excellent 1.2% |