Immigrants from Colombia vs Immigrants from Mexico Disability Age Under 5
COMPARE
Immigrants from Colombia
Immigrants from Mexico
Disability Age Under 5
Disability Age Under 5 Comparison
Immigrants from Colombia
Immigrants from Mexico
1.2%
DISABILITY AGE UNDER 5
79.3/ 100
METRIC RATING
142nd/ 347
METRIC RANK
1.2%
DISABILITY AGE UNDER 5
44.4/ 100
METRIC RATING
180th/ 347
METRIC RANK
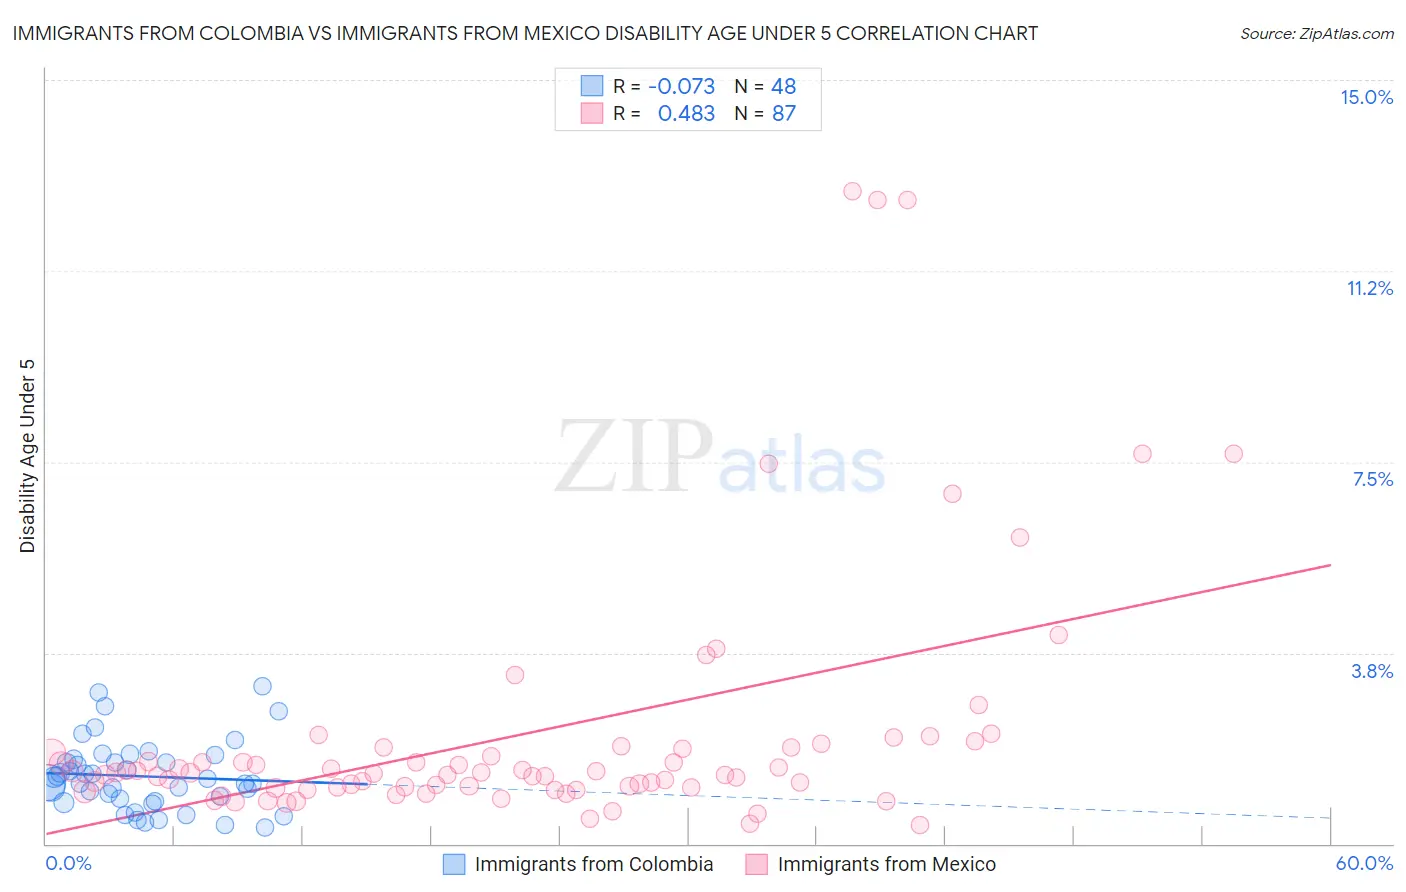
Immigrants from Colombia vs Immigrants from Mexico Disability Age Under 5 Correlation Chart
The statistical analysis conducted on geographies consisting of 209,665,961 people shows a slight negative correlation between the proportion of Immigrants from Colombia and percentage of population with a disability under the age of 5 in the United States with a correlation coefficient (R) of -0.073 and weighted average of 1.2%. Similarly, the statistical analysis conducted on geographies consisting of 251,023,549 people shows a moderate positive correlation between the proportion of Immigrants from Mexico and percentage of population with a disability under the age of 5 in the United States with a correlation coefficient (R) of 0.483 and weighted average of 1.2%, a difference of 3.7%.
Disability Age Under 5 Correlation Summary
| Measurement | Immigrants from Colombia | Immigrants from Mexico |
| Minimum | 0.32% | 0.38% |
| Maximum | 3.1% | 12.8% |
| Range | 2.8% | 12.4% |
| Mean | 1.3% | 2.2% |
| Median | 1.2% | 1.4% |
| Interquartile 25% (IQ1) | 0.86% | 1.1% |
| Interquartile 75% (IQ3) | 1.6% | 1.9% |
| Interquartile Range (IQR) | 0.78% | 0.79% |
| Standard Deviation (Sample) | 0.67% | 2.5% |
| Standard Deviation (Population) | 0.66% | 2.5% |
Similar Demographics by Disability Age Under 5
Demographics Similar to Immigrants from Colombia by Disability Age Under 5
In terms of disability age under 5, the demographic groups most similar to Immigrants from Colombia are Alsatian (1.2%, a difference of 0.010%), Immigrants from Middle Africa (1.2%, a difference of 0.010%), Immigrants from Honduras (1.2%, a difference of 0.15%), Immigrants from Zimbabwe (1.2%, a difference of 0.19%), and Somali (1.2%, a difference of 0.21%).
| Demographics | Rating | Rank | Disability Age Under 5 |
| Fijians | 84.7 /100 | #135 | Excellent 1.2% |
| Moroccans | 83.6 /100 | #136 | Excellent 1.2% |
| Immigrants | Eastern Africa | 83.1 /100 | #137 | Excellent 1.2% |
| Immigrants | Czechoslovakia | 82.8 /100 | #138 | Excellent 1.2% |
| New Zealanders | 81.4 /100 | #139 | Excellent 1.2% |
| Somalis | 80.8 /100 | #140 | Excellent 1.2% |
| Immigrants | Honduras | 80.4 /100 | #141 | Excellent 1.2% |
| Immigrants | Colombia | 79.3 /100 | #142 | Good 1.2% |
| Alsatians | 79.3 /100 | #143 | Good 1.2% |
| Immigrants | Middle Africa | 79.3 /100 | #144 | Good 1.2% |
| Immigrants | Zimbabwe | 77.9 /100 | #145 | Good 1.2% |
| Samoans | 77.7 /100 | #146 | Good 1.2% |
| Icelanders | 76.3 /100 | #147 | Good 1.2% |
| Ghanaians | 76.3 /100 | #148 | Good 1.2% |
| Kenyans | 75.9 /100 | #149 | Good 1.2% |
Demographics Similar to Immigrants from Mexico by Disability Age Under 5
In terms of disability age under 5, the demographic groups most similar to Immigrants from Mexico are Immigrants from Bahamas (1.2%, a difference of 0.070%), Macedonian (1.2%, a difference of 0.070%), Immigrants from Peru (1.2%, a difference of 0.070%), Immigrants from Saudi Arabia (1.2%, a difference of 0.10%), and Palestinian (1.2%, a difference of 0.13%).
| Demographics | Rating | Rank | Disability Age Under 5 |
| Immigrants | Ireland | 50.3 /100 | #173 | Average 1.2% |
| Immigrants | Latvia | 50.0 /100 | #174 | Average 1.2% |
| Immigrants | Nigeria | 50.0 /100 | #175 | Average 1.2% |
| Immigrants | Kenya | 48.6 /100 | #176 | Average 1.2% |
| Comanche | 47.5 /100 | #177 | Average 1.2% |
| Venezuelans | 47.1 /100 | #178 | Average 1.2% |
| Immigrants | Bahamas | 45.2 /100 | #179 | Average 1.2% |
| Immigrants | Mexico | 44.4 /100 | #180 | Average 1.2% |
| Macedonians | 43.7 /100 | #181 | Average 1.2% |
| Immigrants | Peru | 43.7 /100 | #181 | Average 1.2% |
| Immigrants | Saudi Arabia | 43.3 /100 | #183 | Average 1.2% |
| Palestinians | 43.0 /100 | #184 | Average 1.2% |
| Immigrants | Western Africa | 42.5 /100 | #185 | Average 1.2% |
| Cubans | 42.5 /100 | #186 | Average 1.2% |
| Immigrants | Haiti | 40.2 /100 | #187 | Average 1.3% |