Immigrants from Colombia vs Immigrants from Europe Disability Age 65 to 74
COMPARE
Immigrants from Colombia
Immigrants from Europe
Disability Age 65 to 74
Disability Age 65 to 74 Comparison
Immigrants from Colombia
Immigrants from Europe
22.2%
DISABILITY AGE 65 TO 74
96.8/ 100
METRIC RATING
99th/ 347
METRIC RANK
21.6%
DISABILITY AGE 65 TO 74
99.4/ 100
METRIC RATING
63rd/ 347
METRIC RANK
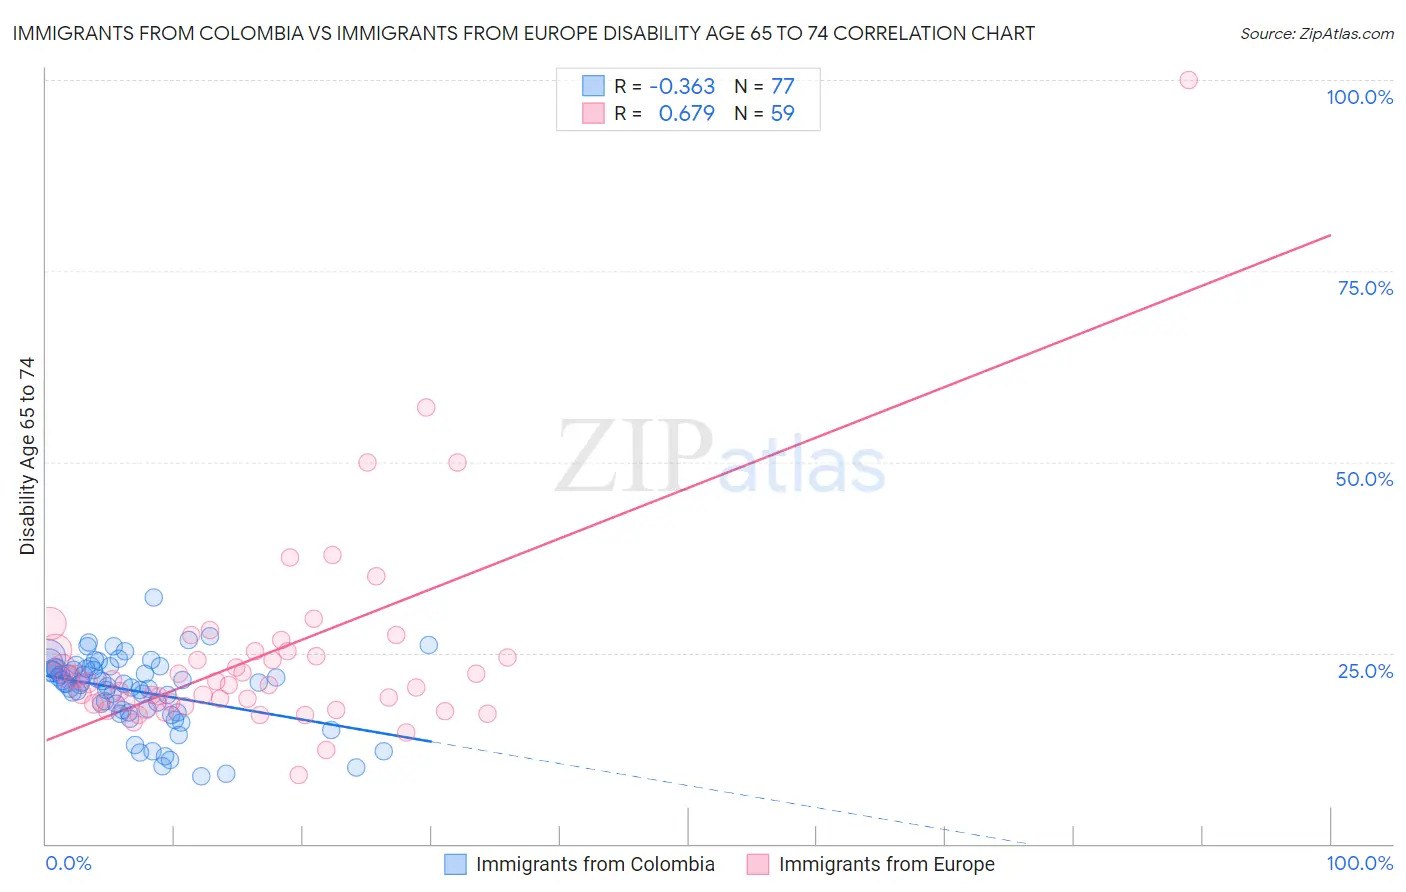
Immigrants from Colombia vs Immigrants from Europe Disability Age 65 to 74 Correlation Chart
The statistical analysis conducted on geographies consisting of 378,083,554 people shows a mild negative correlation between the proportion of Immigrants from Colombia and percentage of population with a disability between the ages 65 and 75 in the United States with a correlation coefficient (R) of -0.363 and weighted average of 22.2%. Similarly, the statistical analysis conducted on geographies consisting of 545,480,102 people shows a significant positive correlation between the proportion of Immigrants from Europe and percentage of population with a disability between the ages 65 and 75 in the United States with a correlation coefficient (R) of 0.679 and weighted average of 21.6%, a difference of 2.8%.
Disability Age 65 to 74 Correlation Summary
| Measurement | Immigrants from Colombia | Immigrants from Europe |
| Minimum | 8.8% | 9.0% |
| Maximum | 32.2% | 100.0% |
| Range | 23.4% | 91.0% |
| Mean | 20.0% | 24.5% |
| Median | 21.0% | 21.1% |
| Interquartile 25% (IQ1) | 17.3% | 18.4% |
| Interquartile 75% (IQ3) | 23.0% | 25.2% |
| Interquartile Range (IQR) | 5.6% | 6.9% |
| Standard Deviation (Sample) | 4.7% | 13.2% |
| Standard Deviation (Population) | 4.6% | 13.1% |
Similar Demographics by Disability Age 65 to 74
Demographics Similar to Immigrants from Colombia by Disability Age 65 to 74
In terms of disability age 65 to 74, the demographic groups most similar to Immigrants from Colombia are Jordanian (22.2%, a difference of 0.030%), Uruguayan (22.2%, a difference of 0.13%), Immigrants from England (22.2%, a difference of 0.14%), Immigrants from Saudi Arabia (22.2%, a difference of 0.17%), and South American (22.2%, a difference of 0.19%).
| Demographics | Rating | Rank | Disability Age 65 to 74 |
| Poles | 97.8 /100 | #92 | Exceptional 22.0% |
| Immigrants | Canada | 97.8 /100 | #93 | Exceptional 22.1% |
| Immigrants | Chile | 97.7 /100 | #94 | Exceptional 22.1% |
| Romanians | 97.7 /100 | #95 | Exceptional 22.1% |
| Immigrants | North America | 97.5 /100 | #96 | Exceptional 22.1% |
| Immigrants | Southern Europe | 97.2 /100 | #97 | Exceptional 22.1% |
| Jordanians | 96.9 /100 | #98 | Exceptional 22.2% |
| Immigrants | Colombia | 96.8 /100 | #99 | Exceptional 22.2% |
| Uruguayans | 96.5 /100 | #100 | Exceptional 22.2% |
| Immigrants | England | 96.5 /100 | #101 | Exceptional 22.2% |
| Immigrants | Saudi Arabia | 96.4 /100 | #102 | Exceptional 22.2% |
| South Americans | 96.4 /100 | #103 | Exceptional 22.2% |
| Colombians | 96.4 /100 | #104 | Exceptional 22.2% |
| Palestinians | 96.3 /100 | #105 | Exceptional 22.2% |
| Peruvians | 96.1 /100 | #106 | Exceptional 22.2% |
Demographics Similar to Immigrants from Europe by Disability Age 65 to 74
In terms of disability age 65 to 74, the demographic groups most similar to Immigrants from Europe are Immigrants from Latvia (21.6%, a difference of 0.080%), Immigrants from Russia (21.6%, a difference of 0.090%), Carpatho Rusyn (21.6%, a difference of 0.10%), Maltese (21.6%, a difference of 0.11%), and Egyptian (21.6%, a difference of 0.13%).
| Demographics | Rating | Rank | Disability Age 65 to 74 |
| Immigrants | Denmark | 99.5 /100 | #56 | Exceptional 21.5% |
| Immigrants | Asia | 99.5 /100 | #57 | Exceptional 21.5% |
| Immigrants | Pakistan | 99.5 /100 | #58 | Exceptional 21.5% |
| Zimbabweans | 99.5 /100 | #59 | Exceptional 21.5% |
| Immigrants | North Macedonia | 99.5 /100 | #60 | Exceptional 21.6% |
| Egyptians | 99.5 /100 | #61 | Exceptional 21.6% |
| Carpatho Rusyns | 99.5 /100 | #62 | Exceptional 21.6% |
| Immigrants | Europe | 99.4 /100 | #63 | Exceptional 21.6% |
| Immigrants | Latvia | 99.4 /100 | #64 | Exceptional 21.6% |
| Immigrants | Russia | 99.4 /100 | #65 | Exceptional 21.6% |
| Maltese | 99.4 /100 | #66 | Exceptional 21.6% |
| Immigrants | South Africa | 99.3 /100 | #67 | Exceptional 21.7% |
| Immigrants | Scotland | 99.3 /100 | #68 | Exceptional 21.7% |
| Immigrants | Egypt | 99.2 /100 | #69 | Exceptional 21.7% |
| Chinese | 99.2 /100 | #70 | Exceptional 21.7% |