Immigrants from Chile vs Immigrants from England Disability Age 5 to 17
COMPARE
Immigrants from Chile
Immigrants from England
Disability Age 5 to 17
Disability Age 5 to 17 Comparison
Immigrants from Chile
Immigrants from England
5.4%
DISABILITY AGE 5 TO 17
95.0/ 100
METRIC RATING
125th/ 347
METRIC RANK
5.6%
DISABILITY AGE 5 TO 17
36.4/ 100
METRIC RATING
181st/ 347
METRIC RANK
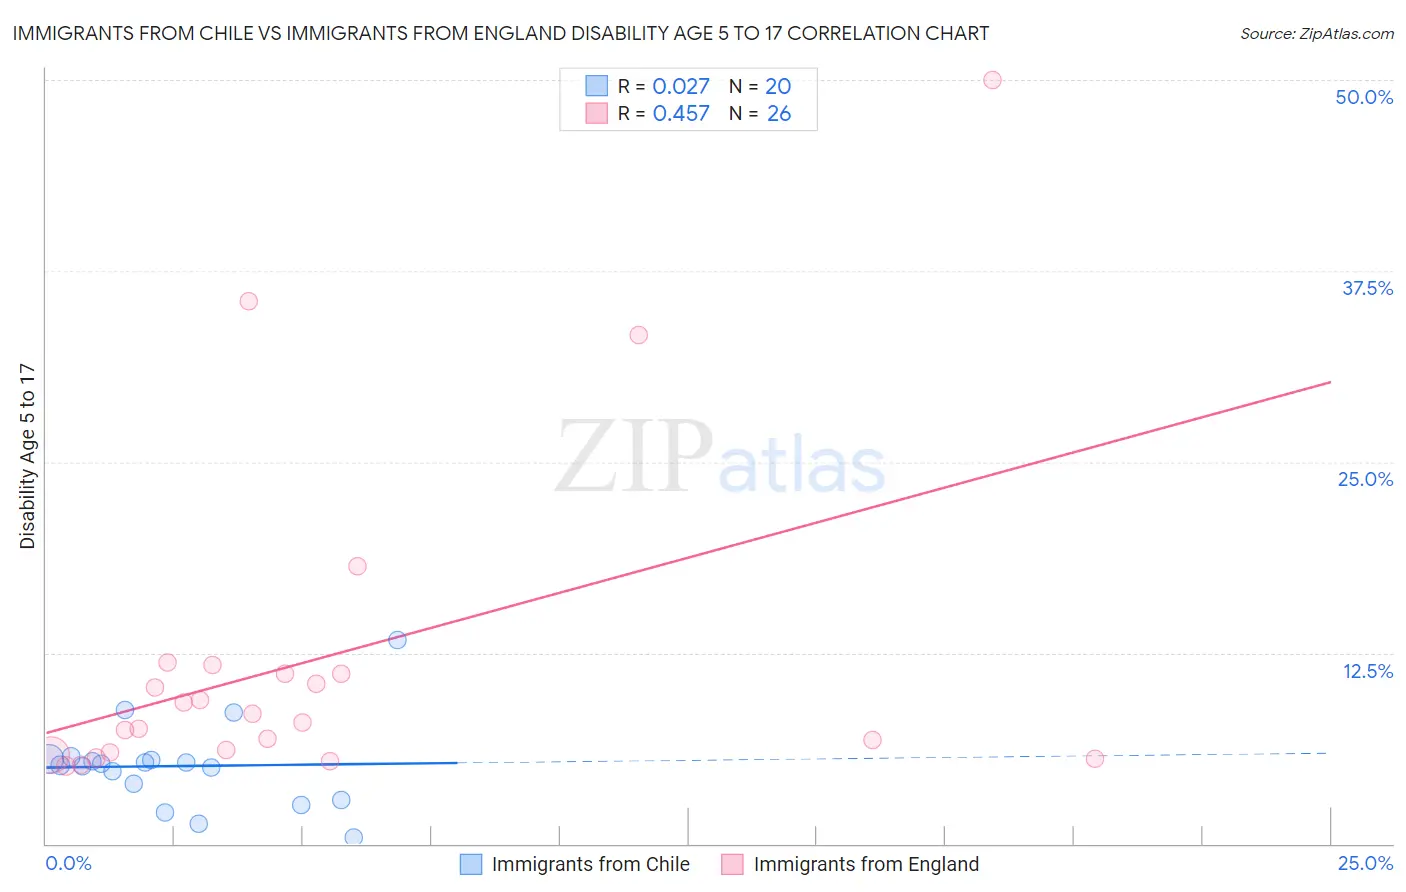
Immigrants from Chile vs Immigrants from England Disability Age 5 to 17 Correlation Chart
The statistical analysis conducted on geographies consisting of 217,781,559 people shows no correlation between the proportion of Immigrants from Chile and percentage of population with a disability between the ages 5 and 17 in the United States with a correlation coefficient (R) of 0.027 and weighted average of 5.4%. Similarly, the statistical analysis conducted on geographies consisting of 388,045,043 people shows a moderate positive correlation between the proportion of Immigrants from England and percentage of population with a disability between the ages 5 and 17 in the United States with a correlation coefficient (R) of 0.457 and weighted average of 5.6%, a difference of 4.5%.
Disability Age 5 to 17 Correlation Summary
| Measurement | Immigrants from Chile | Immigrants from England |
| Minimum | 0.37% | 5.1% |
| Maximum | 13.3% | 50.0% |
| Range | 13.0% | 44.9% |
| Mean | 5.1% | 12.0% |
| Median | 5.2% | 8.2% |
| Interquartile 25% (IQ1) | 3.4% | 6.0% |
| Interquartile 75% (IQ3) | 5.5% | 11.1% |
| Interquartile Range (IQR) | 2.1% | 5.2% |
| Standard Deviation (Sample) | 2.8% | 10.9% |
| Standard Deviation (Population) | 2.8% | 10.7% |
Similar Demographics by Disability Age 5 to 17
Demographics Similar to Immigrants from Chile by Disability Age 5 to 17
In terms of disability age 5 to 17, the demographic groups most similar to Immigrants from Chile are Crow (5.4%, a difference of 0.010%), New Zealander (5.4%, a difference of 0.010%), Latvian (5.4%, a difference of 0.010%), Immigrants from Venezuela (5.4%, a difference of 0.13%), and Immigrants from Ethiopia (5.4%, a difference of 0.15%).
| Demographics | Rating | Rank | Disability Age 5 to 17 |
| South Americans | 97.1 /100 | #118 | Exceptional 5.4% |
| Immigrants | South America | 97.1 /100 | #119 | Exceptional 5.4% |
| Immigrants | Immigrants | 97.0 /100 | #120 | Exceptional 5.4% |
| Maltese | 96.0 /100 | #121 | Exceptional 5.4% |
| Chileans | 95.8 /100 | #122 | Exceptional 5.4% |
| Immigrants | Ethiopia | 95.5 /100 | #123 | Exceptional 5.4% |
| Crow | 95.0 /100 | #124 | Exceptional 5.4% |
| Immigrants | Chile | 95.0 /100 | #125 | Exceptional 5.4% |
| New Zealanders | 95.0 /100 | #126 | Exceptional 5.4% |
| Latvians | 95.0 /100 | #127 | Exceptional 5.4% |
| Immigrants | Venezuela | 94.5 /100 | #128 | Exceptional 5.4% |
| Romanians | 94.1 /100 | #129 | Exceptional 5.4% |
| Immigrants | Bulgaria | 94.0 /100 | #130 | Exceptional 5.4% |
| Arabs | 92.9 /100 | #131 | Exceptional 5.4% |
| Immigrants | Colombia | 92.9 /100 | #132 | Exceptional 5.4% |
Demographics Similar to Immigrants from England by Disability Age 5 to 17
In terms of disability age 5 to 17, the demographic groups most similar to Immigrants from England are Mexican American Indian (5.6%, a difference of 0.060%), Immigrants from Uruguay (5.6%, a difference of 0.070%), Immigrants from Latin America (5.6%, a difference of 0.11%), Syrian (5.6%, a difference of 0.14%), and Immigrants from Mexico (5.6%, a difference of 0.14%).
| Demographics | Rating | Rank | Disability Age 5 to 17 |
| Costa Ricans | 50.0 /100 | #174 | Average 5.6% |
| Shoshone | 49.4 /100 | #175 | Average 5.6% |
| Immigrants | Central America | 49.4 /100 | #176 | Average 5.6% |
| Immigrants | Western Europe | 47.8 /100 | #177 | Average 5.6% |
| Immigrants | Trinidad and Tobago | 47.6 /100 | #178 | Average 5.6% |
| Immigrants | Barbados | 40.5 /100 | #179 | Average 5.6% |
| Immigrants | Uruguay | 37.7 /100 | #180 | Fair 5.6% |
| Immigrants | England | 36.4 /100 | #181 | Fair 5.6% |
| Mexican American Indians | 35.2 /100 | #182 | Fair 5.6% |
| Immigrants | Latin America | 34.3 /100 | #183 | Fair 5.6% |
| Syrians | 33.8 /100 | #184 | Fair 5.6% |
| Immigrants | Mexico | 33.7 /100 | #185 | Fair 5.6% |
| Fijians | 31.7 /100 | #186 | Fair 5.7% |
| Immigrants | Thailand | 30.2 /100 | #187 | Fair 5.7% |
| Marshallese | 28.1 /100 | #188 | Fair 5.7% |