Immigrants from Chile vs Ethiopian Disability Age 5 to 17
COMPARE
Immigrants from Chile
Ethiopian
Disability Age 5 to 17
Disability Age 5 to 17 Comparison
Immigrants from Chile
Ethiopians
5.4%
DISABILITY AGE 5 TO 17
95.0/ 100
METRIC RATING
125th/ 347
METRIC RANK
5.3%
DISABILITY AGE 5 TO 17
97.9/ 100
METRIC RATING
111th/ 347
METRIC RANK
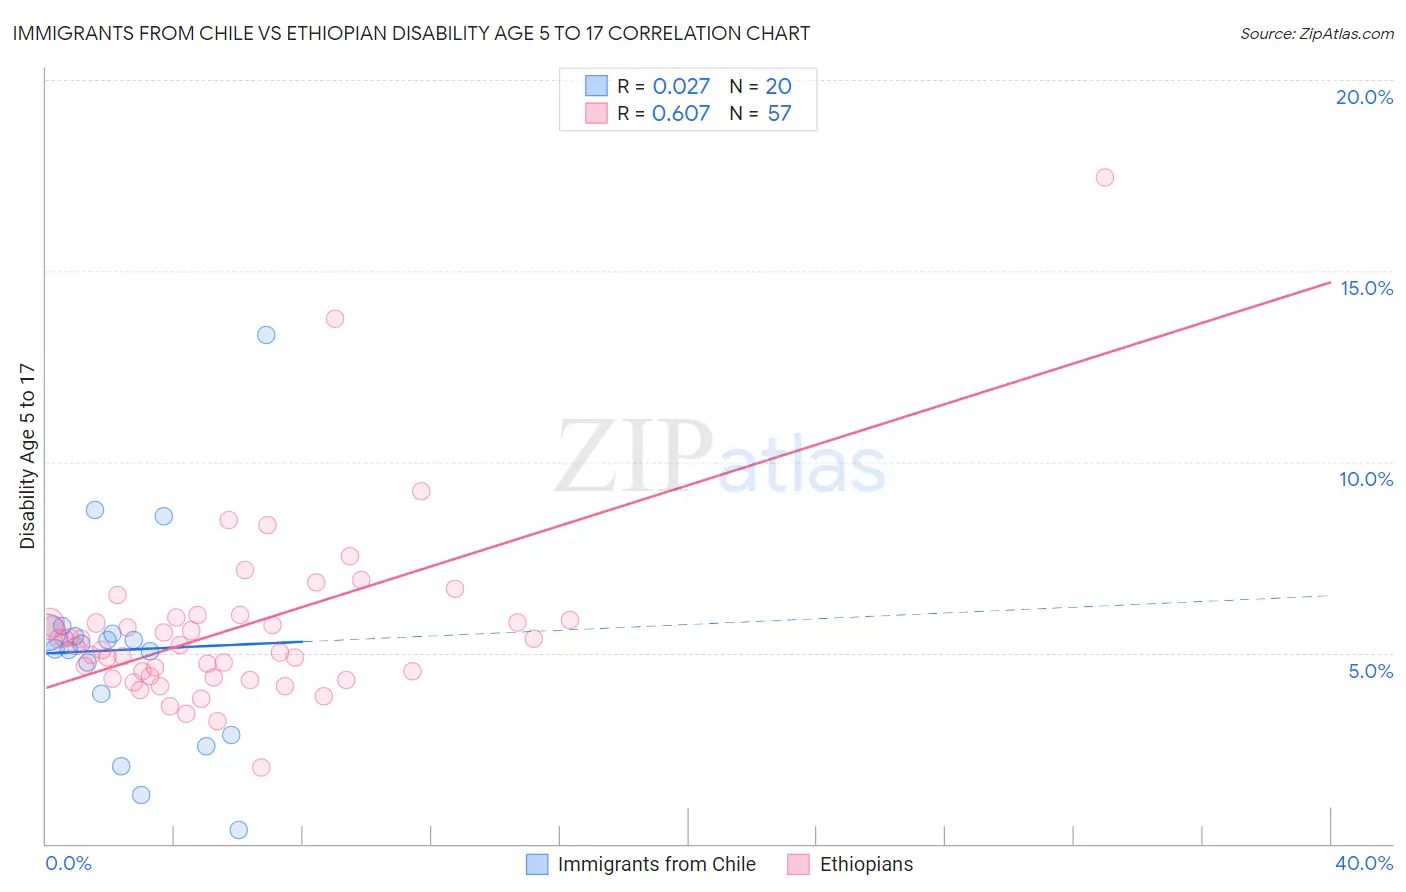
Immigrants from Chile vs Ethiopian Disability Age 5 to 17 Correlation Chart
The statistical analysis conducted on geographies consisting of 217,781,559 people shows no correlation between the proportion of Immigrants from Chile and percentage of population with a disability between the ages 5 and 17 in the United States with a correlation coefficient (R) of 0.027 and weighted average of 5.4%. Similarly, the statistical analysis conducted on geographies consisting of 222,418,387 people shows a significant positive correlation between the proportion of Ethiopians and percentage of population with a disability between the ages 5 and 17 in the United States with a correlation coefficient (R) of 0.607 and weighted average of 5.3%, a difference of 1.2%.
Disability Age 5 to 17 Correlation Summary
| Measurement | Immigrants from Chile | Ethiopian |
| Minimum | 0.37% | 2.0% |
| Maximum | 13.3% | 17.5% |
| Range | 13.0% | 15.4% |
| Mean | 5.1% | 5.6% |
| Median | 5.2% | 5.2% |
| Interquartile 25% (IQ1) | 3.4% | 4.4% |
| Interquartile 75% (IQ3) | 5.5% | 5.9% |
| Interquartile Range (IQR) | 2.1% | 1.5% |
| Standard Deviation (Sample) | 2.8% | 2.3% |
| Standard Deviation (Population) | 2.8% | 2.3% |
Demographics Similar to Immigrants from Chile and Ethiopians by Disability Age 5 to 17
In terms of disability age 5 to 17, the demographic groups most similar to Immigrants from Chile are Crow (5.4%, a difference of 0.010%), New Zealander (5.4%, a difference of 0.010%), Latvian (5.4%, a difference of 0.010%), Immigrants from Venezuela (5.4%, a difference of 0.13%), and Immigrants from Ethiopia (5.4%, a difference of 0.15%). Similarly, the demographic groups most similar to Ethiopians are Immigrants from Latvia (5.3%, a difference of 0.020%), Immigrants from Eritrea (5.3%, a difference of 0.040%), Aleut (5.3%, a difference of 0.060%), Immigrants from Northern Africa (5.3%, a difference of 0.080%), and Immigrants from Northern Europe (5.3%, a difference of 0.090%).
| Demographics | Rating | Rank | Disability Age 5 to 17 |
| Immigrants | South Africa | 98.1 /100 | #108 | Exceptional 5.3% |
| Immigrants | Northern Africa | 98.1 /100 | #109 | Exceptional 5.3% |
| Immigrants | Eritrea | 98.0 /100 | #110 | Exceptional 5.3% |
| Ethiopians | 97.9 /100 | #111 | Exceptional 5.3% |
| Immigrants | Latvia | 97.9 /100 | #112 | Exceptional 5.3% |
| Aleuts | 97.8 /100 | #113 | Exceptional 5.3% |
| Immigrants | Northern Europe | 97.8 /100 | #114 | Exceptional 5.3% |
| Cubans | 97.8 /100 | #115 | Exceptional 5.3% |
| Cypriots | 97.7 /100 | #116 | Exceptional 5.3% |
| Immigrants | Afghanistan | 97.4 /100 | #117 | Exceptional 5.3% |
| South Americans | 97.1 /100 | #118 | Exceptional 5.4% |
| Immigrants | South America | 97.1 /100 | #119 | Exceptional 5.4% |
| Immigrants | Immigrants | 97.0 /100 | #120 | Exceptional 5.4% |
| Maltese | 96.0 /100 | #121 | Exceptional 5.4% |
| Chileans | 95.8 /100 | #122 | Exceptional 5.4% |
| Immigrants | Ethiopia | 95.5 /100 | #123 | Exceptional 5.4% |
| Crow | 95.0 /100 | #124 | Exceptional 5.4% |
| Immigrants | Chile | 95.0 /100 | #125 | Exceptional 5.4% |
| New Zealanders | 95.0 /100 | #126 | Exceptional 5.4% |
| Latvians | 95.0 /100 | #127 | Exceptional 5.4% |
| Immigrants | Venezuela | 94.5 /100 | #128 | Exceptional 5.4% |