Immigrants from Chile vs European Disability Age 5 to 17
COMPARE
Immigrants from Chile
European
Disability Age 5 to 17
Disability Age 5 to 17 Comparison
Immigrants from Chile
Europeans
5.4%
DISABILITY AGE 5 TO 17
95.0/ 100
METRIC RATING
125th/ 347
METRIC RANK
5.8%
DISABILITY AGE 5 TO 17
4.5/ 100
METRIC RATING
231st/ 347
METRIC RANK
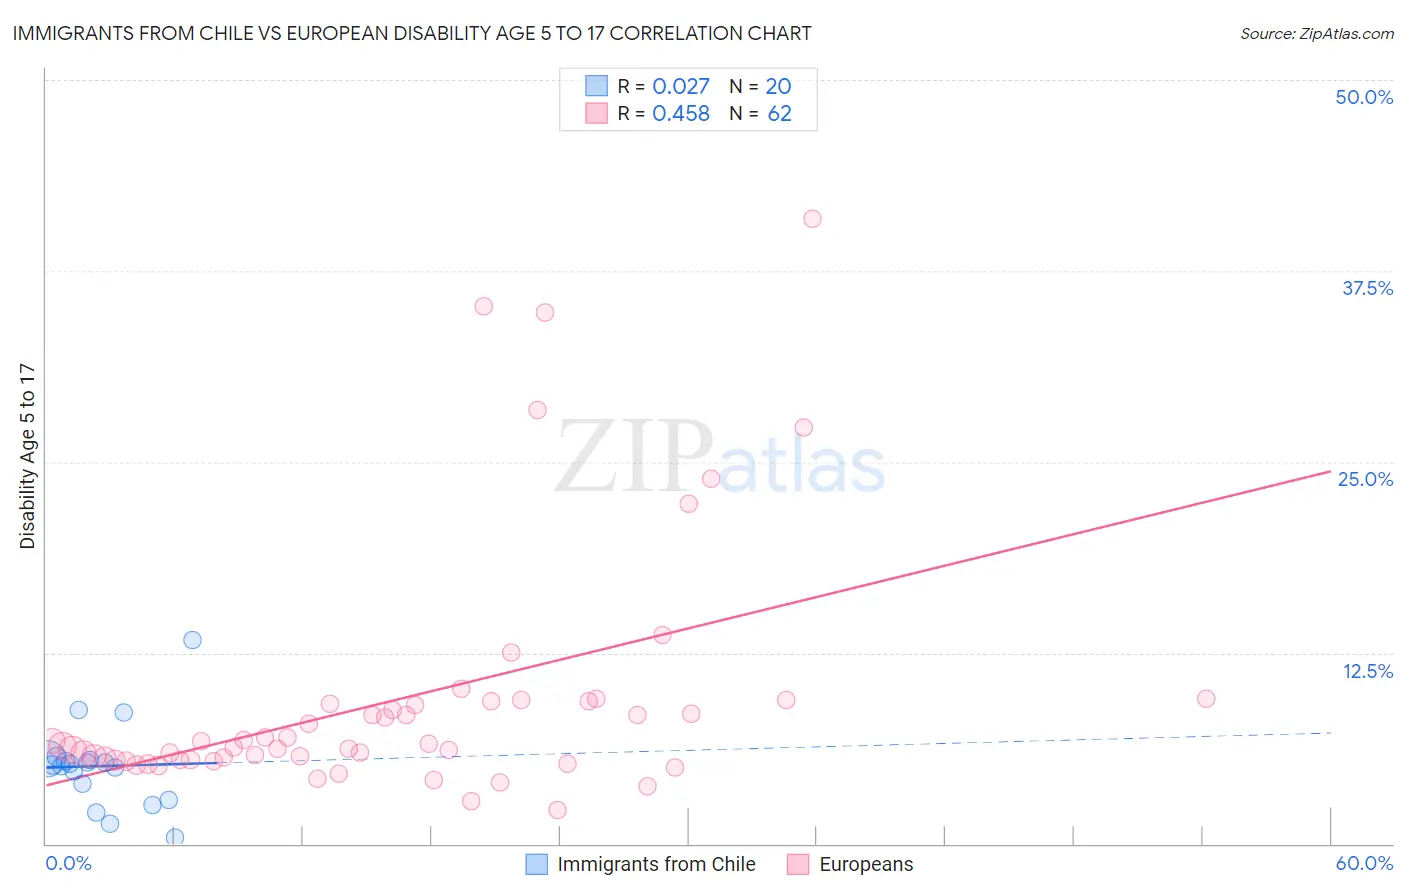
Immigrants from Chile vs European Disability Age 5 to 17 Correlation Chart
The statistical analysis conducted on geographies consisting of 217,781,559 people shows no correlation between the proportion of Immigrants from Chile and percentage of population with a disability between the ages 5 and 17 in the United States with a correlation coefficient (R) of 0.027 and weighted average of 5.4%. Similarly, the statistical analysis conducted on geographies consisting of 549,684,135 people shows a moderate positive correlation between the proportion of Europeans and percentage of population with a disability between the ages 5 and 17 in the United States with a correlation coefficient (R) of 0.458 and weighted average of 5.8%, a difference of 7.7%.
Disability Age 5 to 17 Correlation Summary
| Measurement | Immigrants from Chile | European |
| Minimum | 0.37% | 2.2% |
| Maximum | 13.3% | 40.9% |
| Range | 13.0% | 38.7% |
| Mean | 5.1% | 9.4% |
| Median | 5.2% | 6.5% |
| Interquartile 25% (IQ1) | 3.4% | 5.5% |
| Interquartile 75% (IQ3) | 5.5% | 9.3% |
| Interquartile Range (IQR) | 2.1% | 3.8% |
| Standard Deviation (Sample) | 2.8% | 8.1% |
| Standard Deviation (Population) | 2.8% | 8.0% |
Similar Demographics by Disability Age 5 to 17
Demographics Similar to Immigrants from Chile by Disability Age 5 to 17
In terms of disability age 5 to 17, the demographic groups most similar to Immigrants from Chile are Crow (5.4%, a difference of 0.010%), New Zealander (5.4%, a difference of 0.010%), Latvian (5.4%, a difference of 0.010%), Immigrants from Venezuela (5.4%, a difference of 0.13%), and Immigrants from Ethiopia (5.4%, a difference of 0.15%).
| Demographics | Rating | Rank | Disability Age 5 to 17 |
| South Americans | 97.1 /100 | #118 | Exceptional 5.4% |
| Immigrants | South America | 97.1 /100 | #119 | Exceptional 5.4% |
| Immigrants | Immigrants | 97.0 /100 | #120 | Exceptional 5.4% |
| Maltese | 96.0 /100 | #121 | Exceptional 5.4% |
| Chileans | 95.8 /100 | #122 | Exceptional 5.4% |
| Immigrants | Ethiopia | 95.5 /100 | #123 | Exceptional 5.4% |
| Crow | 95.0 /100 | #124 | Exceptional 5.4% |
| Immigrants | Chile | 95.0 /100 | #125 | Exceptional 5.4% |
| New Zealanders | 95.0 /100 | #126 | Exceptional 5.4% |
| Latvians | 95.0 /100 | #127 | Exceptional 5.4% |
| Immigrants | Venezuela | 94.5 /100 | #128 | Exceptional 5.4% |
| Romanians | 94.1 /100 | #129 | Exceptional 5.4% |
| Immigrants | Bulgaria | 94.0 /100 | #130 | Exceptional 5.4% |
| Arabs | 92.9 /100 | #131 | Exceptional 5.4% |
| Immigrants | Colombia | 92.9 /100 | #132 | Exceptional 5.4% |
Demographics Similar to Europeans by Disability Age 5 to 17
In terms of disability age 5 to 17, the demographic groups most similar to Europeans are Ghanaian (5.8%, a difference of 0.070%), Bangladeshi (5.8%, a difference of 0.080%), Haitian (5.8%, a difference of 0.090%), Swiss (5.8%, a difference of 0.17%), and Immigrants from Laos (5.8%, a difference of 0.20%).
| Demographics | Rating | Rank | Disability Age 5 to 17 |
| Mexicans | 5.7 /100 | #224 | Tragic 5.8% |
| Guamanians/Chamorros | 5.6 /100 | #225 | Tragic 5.8% |
| British West Indians | 5.4 /100 | #226 | Tragic 5.8% |
| Swiss | 5.1 /100 | #227 | Tragic 5.8% |
| Haitians | 4.8 /100 | #228 | Tragic 5.8% |
| Bangladeshis | 4.8 /100 | #229 | Tragic 5.8% |
| Ghanaians | 4.7 /100 | #230 | Tragic 5.8% |
| Europeans | 4.5 /100 | #231 | Tragic 5.8% |
| Immigrants | Laos | 3.8 /100 | #232 | Tragic 5.8% |
| Immigrants | West Indies | 3.5 /100 | #233 | Tragic 5.8% |
| Immigrants | Kenya | 3.4 /100 | #234 | Tragic 5.8% |
| Malaysians | 3.4 /100 | #235 | Tragic 5.8% |
| Immigrants | Brazil | 3.2 /100 | #236 | Tragic 5.8% |
| Sudanese | 2.9 /100 | #237 | Tragic 5.8% |
| Hungarians | 2.6 /100 | #238 | Tragic 5.8% |