Burmese vs Immigrants from England Disability Age 5 to 17
COMPARE
Burmese
Immigrants from England
Disability Age 5 to 17
Disability Age 5 to 17 Comparison
Burmese
Immigrants from England
4.8%
DISABILITY AGE 5 TO 17
100.0/ 100
METRIC RATING
20th/ 347
METRIC RANK
5.6%
DISABILITY AGE 5 TO 17
36.4/ 100
METRIC RATING
181st/ 347
METRIC RANK
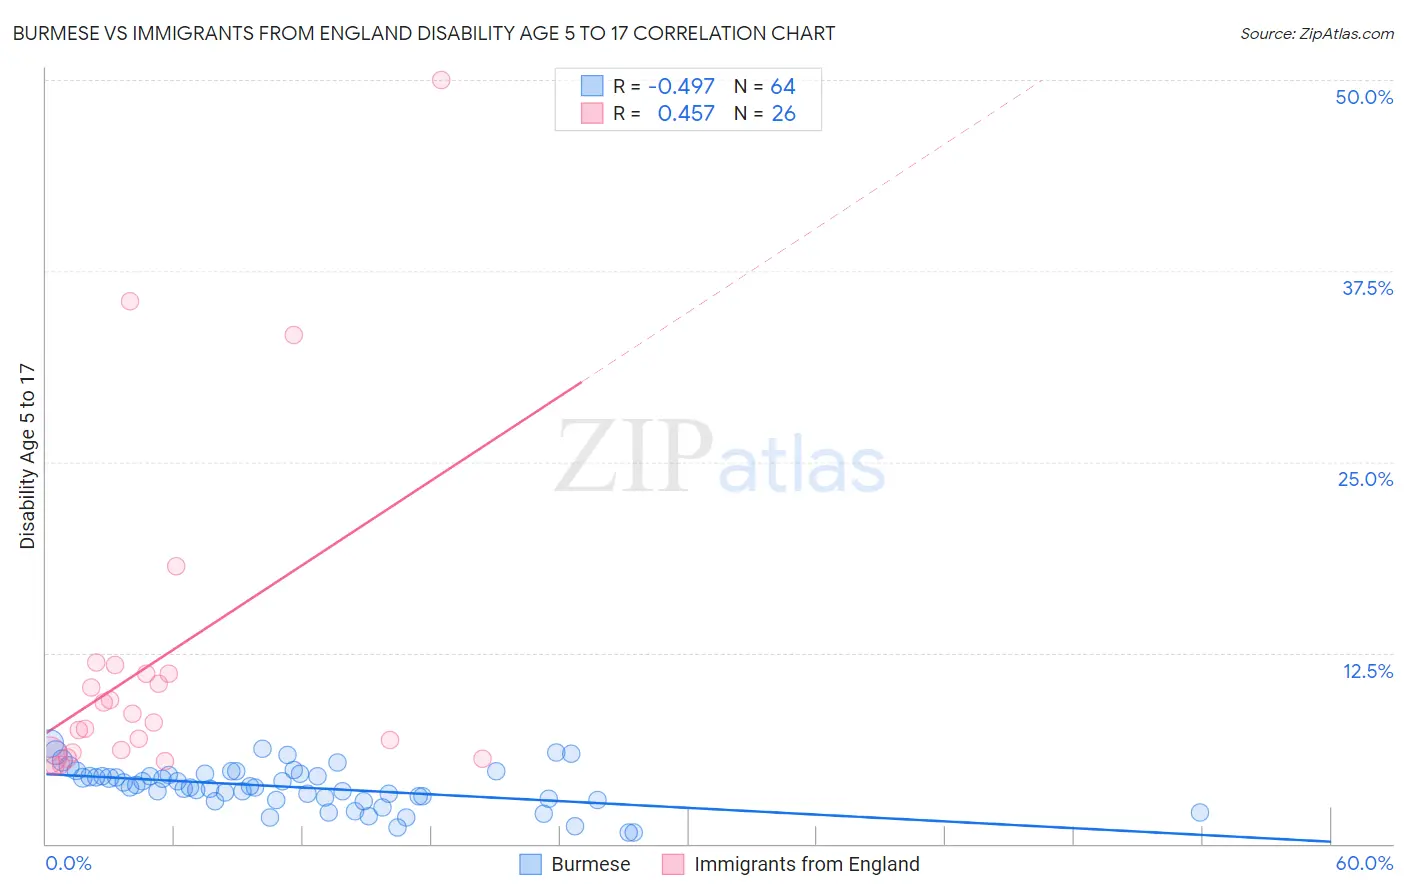
Burmese vs Immigrants from England Disability Age 5 to 17 Correlation Chart
The statistical analysis conducted on geographies consisting of 460,493,605 people shows a moderate negative correlation between the proportion of Burmese and percentage of population with a disability between the ages 5 and 17 in the United States with a correlation coefficient (R) of -0.497 and weighted average of 4.8%. Similarly, the statistical analysis conducted on geographies consisting of 388,045,043 people shows a moderate positive correlation between the proportion of Immigrants from England and percentage of population with a disability between the ages 5 and 17 in the United States with a correlation coefficient (R) of 0.457 and weighted average of 5.6%, a difference of 18.0%.
Disability Age 5 to 17 Correlation Summary
| Measurement | Burmese | Immigrants from England |
| Minimum | 0.73% | 5.1% |
| Maximum | 6.5% | 50.0% |
| Range | 5.8% | 44.9% |
| Mean | 3.7% | 12.0% |
| Median | 3.7% | 8.2% |
| Interquartile 25% (IQ1) | 2.9% | 6.0% |
| Interquartile 75% (IQ3) | 4.5% | 11.1% |
| Interquartile Range (IQR) | 1.6% | 5.2% |
| Standard Deviation (Sample) | 1.4% | 10.9% |
| Standard Deviation (Population) | 1.3% | 10.7% |
Similar Demographics by Disability Age 5 to 17
Demographics Similar to Burmese by Disability Age 5 to 17
In terms of disability age 5 to 17, the demographic groups most similar to Burmese are Yup'ik (4.8%, a difference of 0.22%), Immigrants from Uzbekistan (4.8%, a difference of 0.38%), Asian (4.8%, a difference of 0.56%), Immigrants from South Central Asia (4.7%, a difference of 0.87%), and Arapaho (4.7%, a difference of 0.89%).
| Demographics | Rating | Rank | Disability Age 5 to 17 |
| Thais | 100.0 /100 | #13 | Exceptional 4.7% |
| Immigrants | Korea | 100.0 /100 | #14 | Exceptional 4.7% |
| Chinese | 100.0 /100 | #15 | Exceptional 4.7% |
| Immigrants | Singapore | 100.0 /100 | #16 | Exceptional 4.7% |
| Arapaho | 100.0 /100 | #17 | Exceptional 4.7% |
| Immigrants | South Central Asia | 100.0 /100 | #18 | Exceptional 4.7% |
| Immigrants | Uzbekistan | 100.0 /100 | #19 | Exceptional 4.8% |
| Burmese | 100.0 /100 | #20 | Exceptional 4.8% |
| Yup'ik | 100.0 /100 | #21 | Exceptional 4.8% |
| Asians | 100.0 /100 | #22 | Exceptional 4.8% |
| Immigrants | Bolivia | 100.0 /100 | #23 | Exceptional 4.8% |
| Immigrants | Lebanon | 100.0 /100 | #24 | Exceptional 4.8% |
| Immigrants | Asia | 100.0 /100 | #25 | Exceptional 4.8% |
| Bhutanese | 100.0 /100 | #26 | Exceptional 4.9% |
| Taiwanese | 100.0 /100 | #27 | Exceptional 4.9% |
Demographics Similar to Immigrants from England by Disability Age 5 to 17
In terms of disability age 5 to 17, the demographic groups most similar to Immigrants from England are Mexican American Indian (5.6%, a difference of 0.060%), Immigrants from Uruguay (5.6%, a difference of 0.070%), Immigrants from Latin America (5.6%, a difference of 0.11%), Syrian (5.6%, a difference of 0.14%), and Immigrants from Mexico (5.6%, a difference of 0.14%).
| Demographics | Rating | Rank | Disability Age 5 to 17 |
| Costa Ricans | 50.0 /100 | #174 | Average 5.6% |
| Shoshone | 49.4 /100 | #175 | Average 5.6% |
| Immigrants | Central America | 49.4 /100 | #176 | Average 5.6% |
| Immigrants | Western Europe | 47.8 /100 | #177 | Average 5.6% |
| Immigrants | Trinidad and Tobago | 47.6 /100 | #178 | Average 5.6% |
| Immigrants | Barbados | 40.5 /100 | #179 | Average 5.6% |
| Immigrants | Uruguay | 37.7 /100 | #180 | Fair 5.6% |
| Immigrants | England | 36.4 /100 | #181 | Fair 5.6% |
| Mexican American Indians | 35.2 /100 | #182 | Fair 5.6% |
| Immigrants | Latin America | 34.3 /100 | #183 | Fair 5.6% |
| Syrians | 33.8 /100 | #184 | Fair 5.6% |
| Immigrants | Mexico | 33.7 /100 | #185 | Fair 5.6% |
| Fijians | 31.7 /100 | #186 | Fair 5.7% |
| Immigrants | Thailand | 30.2 /100 | #187 | Fair 5.7% |
| Marshallese | 28.1 /100 | #188 | Fair 5.7% |